Euro-Dollar Analysis Decoding the 1.171 False Breakout and Next Price Targets
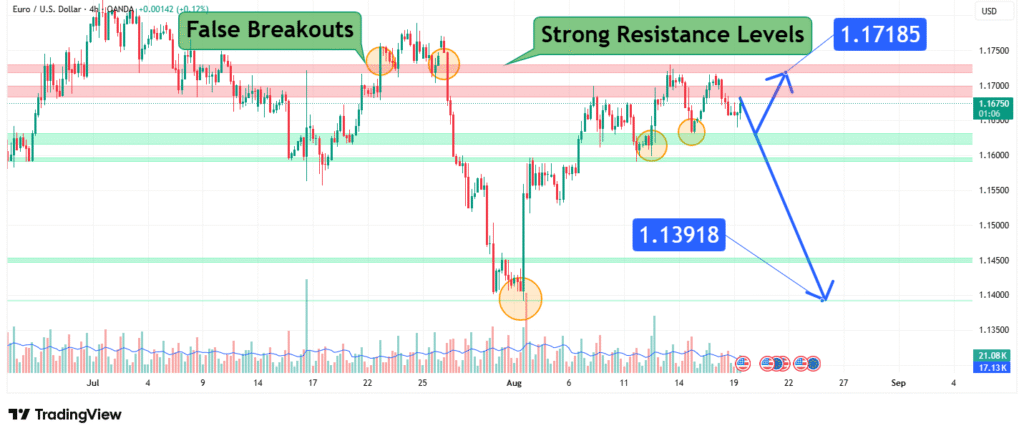
The EUR/USD currency pair, the most traded financial instrument globally, is currently exhibiting technically significant behavior characterized by false breakouts around major resistance levels. These failed breakouts, occurring near the 1.17185 and 1.17918 levels, indicate a market struggling to find sustained directional momentum. Meanwhile, the 1.13918 level represents a more substantial support-turned-resistance zone that has proven historically significant. This analysis will deconstruct the current price action, explain the implications of false breakouts, and outline the strategic implications for two primary price targets: a retest of 1.171 on continued strength or a rejection toward 1.139.
The Anatomy of False Breakouts and Their Significance
A false breakout, or “bull trap,” occurs when the price of an asset moves beyond a defined resistance level (or support level) but fails to sustain the move and quickly reverses back into the previous trading range. This phenomenon is a powerful signal that often precedes significant moves in the opposite direction.
- Market Psychology: False breakouts typically trap inexperienced traders who enter positions immediately after the breakout is apparent. When these positions are quickly proven wrong, the ensuing rush to exit accelerates the reversal.
- Institutional Activity: These patterns often indicate that large players are providing liquidity against these breakouts, allowing retail traders to buy at the highs before institutions push the price lower.
- Current Context: The failed breaks above 1.17185 and 1.17918 suggest that despite some buying interest, overwhelming selling pressure exists at these levels. Each failure diminishes the power of subsequent attempts to break higher and increases the probability of a deeper pullback.
Analyzing the Strong Resistance Levels: 1.17185, 1.17918, and 1.13918
The resistance levels identified are not arbitrary; they represent key zones where market structure has repeatedly shifted.
- 1.17918 Resistance: This is likely the most recent and immediate ceiling. A false breakout above this level would be a profoundly bearish short-term signal, indicating exhaustion among buyers.
- 1.17185 Resistance: This appears to be a primary resistance zone that has been tested multiple times. It acts as a gateway to higher prices. A clean break and close above this level on a daily or weekly chart would be necessary to invalidate the current bearish pressure from the false breaks.
- 1.13918 Resistance (Key Level): This is the most critical level on the chart. Its mention suggests it was a major historical support level that, once broken, has now flipped into a strong resistance role (a classic “support turned resistance” principle). This is a zone where any bullish bounce would be expected to stall.

Current Market Context and Macro Drivers
The EUR/USD is not trading in a vacuum. The pair is being influenced by:
- Divergent Central Bank Policies: The market’s perception of the Federal Reserve’s hawkish stance relative to the European Central Bank’s more cautious approach is a primary driver.
- Risk Sentiment: As a proxy for global risk appetite, periods of market stress can strengthen the USD (weakening EUR/USD), while risk-on environments can provide a tailwind for the Euro.
- Geopolitical Factors: Energy security in Europe and broader global economic uncertainty are creating volatility, often favoring the dollar’s safe-haven status.
Price Prediction and Scenario Analysis
Based on the prevalence of false breakouts and the strength of the overhead resistance, we can define two clear scenarios.
Scenario 1: Bearish Rejection (Primary Target: 1.139)
- Trigger: A clear rejection from current levels or from a final test of the 1.171 resistance, confirmed by a bearish engulfing pattern or a sharp reversal candle on the daily chart.
- Rationale: The repeated false breakouts demonstrate a lack of genuine buying power to sustain a rally. This often culminates in a “give-up” phase where sellers take control.
- Target: The primary target for a bearish move is a retest of the major 1.139 level. This would represent a full retracement to a key historical level, where buyers would be expected to重新评估 (re-assess) the market.
Scenario 2: Bullish Breakout (Target: 1.171)
- Trigger: A sustained daily close above 1.171, backed by strong volume and a fundamental catalyst (e.g., a dovish shift from the Fed or a surprisingly hawkish ECB).
- Rationale: This would invalidate the current false breakout narrative and signal that buyers have finally absorbed all available supply at this key level.
- Target: The initial target would be a retest of the recent false breakout high near 1.179.
Trading Strategy and Risk Management
Navigating false breakouts requires patience and discipline.
- For Bears (Favoring a move to 1.139): The optimal entry is on a clear rejection candle after a false breakout above 1.171 or 1.179. A stop-loss should be placed just above the recent false high. The profit target is 1.139.
- For Bulls (Favoring a break higher): Wait for a confirmed, strong daily close above 1.171 before entering. A stop-loss should be placed below a recent swing low. The first target would be 1.179.
- Risk Management: False breakouts are volatile. Position sizes must be conservative to withstand whipsaw price action. The key is to wait for confirmation—never anticipate the breakout or breakdown.
Conclusion
The EUR/USD is at a critical juncture, characterized by deceptive false breakouts that are likely trapping bullish participants. The resistance levels at 1.17185 and 1.17918 are proving to be significant barriers, while 1.13918 looms as a major target for any sustained downturn. The weight of evidence currently favors a bearish resolution toward the 1.139 target, unless buyers can force a powerful and sustained close above 1.171. Traders should adopt a patient, reactionary approach, waiting for the market to show its next clear move after the current period of distribution and deception.
How did this post make you feel?
Thanks for your reaction!


