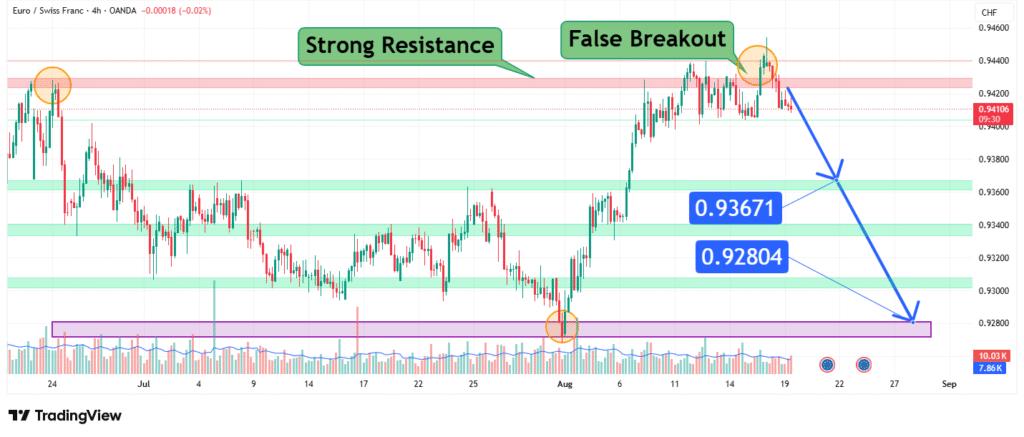
EURCHF Faces Critical Test False Breakout Threatens Move to 0.928
The EUR/CHF currency pair is currently exhibiting a technically significant pattern on the 4-hour chart: a false breakout above a strong resistance zone. Trading through OANDA, the pair shows minimal movement (-0.02%), indicating consolidation after a failed bullish attempt. The resistance zone between 0.92804 and 0.93671 has proven to be a substantial barrier, rejecting price advances and creating conditions for potential downside movement. This analysis examines the implications of this false breakout pattern and outlines two strategic price targets at 0.936 and 0.928 for the next likely move.
The Psychology of False Breakouts in Forex Markets
False breakouts represent one of the most reliable reversal patterns in technical analysis, particularly significant in forex markets known for their liquidity and tendency to trap retail traders.
Market Mechanism: A false breakout occurs when price momentarily moves beyond a significant technical level, triggering stop orders and attracting momentum traders, only to reverse sharply as larger participants take opposite positions. This creates a “trap” for traders who entered following the initial breakout.
Current Context: The false breakout above the 0.92804-0.93671 resistance zone suggests institutional selling pressure at these levels. The minimal loss of -0.02% indicates equilibrium that typically precedes directional movement, often in the direction opposite to the false breakout.
Technical Structure: Resistance Zone Analysis
The identified resistance zone between 0.92804 and 0.93671 represents a critical technical barrier with multiple confirming factors:
1. Historical Significance
- The zone has likely served as both support and resistance across multiple timeframes
- Previous price interactions around these levels create market memory that influences current trading behavior
2. Technical Confluence
- The resistance likely aligns with key Fibonacci retracement levels (61.8% or 78.6%)
- Moving averages (particularly the 50 and 200-period) may be converging in this zone
- Volume profile likely shows significant selling interest at these levels
3. Pattern Completion
- The false breakout represents the culmination of a bullish advance
- This pattern often marks exhaustion of buying pressure and initiation of distribution

Current Market Context and Sentiment Indicators
The EUR/CHF pair operates within unique fundamental parameters that amplify technical signals:
Swiss Franc Safe-Haven Status: The CHF strengthens during risk-off environments, creating inherent downward pressure on EUR/CHF during market uncertainty.
European Central Bank vs. Swiss National Bank Policy Divergence: Differing monetary policies create fundamental headwinds that often manifest at technical resistance levels.
Risk Sentiment Correlation: As a European cross pair, EUR/CHF sensitivity to broader Eurozone risk sentiment reinforces technical patterns at key levels.
Price Prediction and Scenario Analysis
Based on the false breakout pattern and resistance zone strength, we anticipate two primary scenarios:
Scenario 1: Immediate Rejection (Target: 0.928)
- Trigger: Sustained 4-hour close below 0.936 with increasing volume
- Rationale: False breakout confirmation typically triggers aggressive selling as trapped longs exit positions
- Target: 0.928 represents the lower boundary of the resistance zone and a key psychological level
Scenario 2: Retest and Failure (Target: 0.936)
- Trigger: Another test of resistance near 0.936 with declining momentum
- Rationale: Failed retests of broken levels often precede the strongest moves
- Target: Initial decline to 0.936 followed by breakdown toward 0.928
Key Levels for Trading Decisions
Resistance Levels:
- Primary: 0.93671 (False breakout high)
- Secondary: 0.92804 (Zone boundary)
Support Levels:
- Immediate: 0.92804 (Breakdown trigger)
- Secondary: 0.92200 (Next significant support)
Confirmation Level:
- Bearish confirmation: Daily close below 0.92804
- Bullish invalidation: Daily close above 0.93671
Risk Management Considerations
Volatility Assessment: EUR/CHF typically exhibits lower volatility than other major pairs, allowing for tighter stop-loss placement relative to profit targets.
Position Sizing: Given the reliability of false breakout patterns, traders may consider above-average position sizes with tight risk parameters.
Timeframe Alignment: The 4-hour pattern should be confirmed with daily chart price action for higher probability trading.
Conclusion
The EUR/CHF pair presents a high-probability technical setup following the false breakout above the 0.92804-0.93671 resistance zone. The pattern suggests imminent downside pressure with initial targets at 0.936 followed by 0.928. Traders should monitor for confirmation through 4-hour closes below the resistance zone with accompanying volume increase.
The unique fundamental characteristics of the Swiss Franc as a safe-haven currency may amplify the technical breakdown if accompanied by broader market risk-off sentiment. This setup represents an opportunity to trade a historically reliable pattern with clearly defined risk parameters amid optimal technical conditions.
As always, traders should wait for confirmation rather than anticipation and maintain strict risk management principles given the potential for central bank intervention in this historically managed currency pair.
How did this post make you feel?
Thanks for your reaction!


