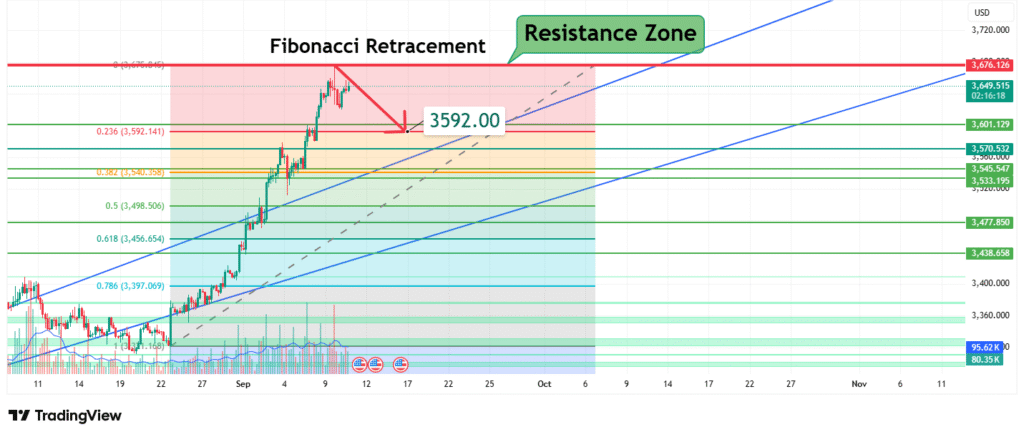
Gold Price Analysis Rejection at Resistance Projects Decline to $3,592
Gold’s price has rallied strongly but is now exhibiting clear signs of buyer exhaustion as it tests a major resistance zone. This price action suggests a bearish corrective bias is forming. Our analysis projects a move towards a primary target of $3,592. This prediction is based on a confluence of technical factors, primarily a rejection from a key Fibonacci retracement resistance level and the formation of a significant resistance zone.
Current Market Structure and Price Action
The longer-term market structure for Gold remains bullish, characterized by a series of higher highs and higher lows. However, the current, short-term structure shows a potential reversal. The price has experienced a powerful rally and is now struggling to maintain upward momentum. It is currently interacting with a technically significant resistance zone, and recent price action suggests a loss of bullish conviction, indicating that a breakdown and corrective pullback may be imminent.
Identification of the Key Resistance Zone
The most critical technical element on the chart is the potent Resistance Zone between approximately $3,592 and the current price highs. The strength of this zone is derived from:
- Fibonacci Confluence: This zone is defined by key Fibonacci retracement levels drawn from a prior significant swing. The 0.236 level at $3,592.141 and the 0.618 level at $3,656.564 create a strong band of resistance. These levels often act as reversal points where profit-taking occurs.
- Market Psychology: After a strong rally, prices often become overextended. This area represents a point where the sentiment of buyers is likely to weaken, and sellers (profit-takers) are likely to emerge aggressively.
This Fibonacci and psychological confluence makes it a high-probability zone for a bearish reaction.
Technical Target(s) and Rationale
Our analysis identifies the following price target(s):
Primary Target (PT1): $3,592
Rationale: This target is not a lower level, but rather the lower boundary of the current resistance zone itself, specifically the 0.236 Fibonacci level. In a rejection scenario, price often retraces to test the lower edge of the broken structure or key Fib level. A break below the recent consolidation would confirm a shift in short-term momentum towards this target.
Secondary Target (PT2): $3,540 (0.5 Fib level) / $3,498 (0.586 Fib level)
Rationale: A more significant break could see price target the deeper Fibonacci retracement levels at $3,540.298 (0.5) and $3,498.506 (0.586), which would represent a healthier pullback within the larger bullish trend and find stronger support.

Prediction: We forecast that the price will be rejected from the current resistance zone and initiate a bearish corrective move, initially targeting the $3,592 level.
Risk Management Considerations
A professional strategy is defined by its risk management.
- Invalidation Level (Stop-Loss): The entire bearish thesis is invalidated if the price achieves a sustained daily close above the resistance zone, notably above the $3,656 (0.618 Fib) level. This would indicate a failure of the bearish rejection and a continuation of the bullish impulse, likely leading to new highs.
- Position Sizing: Any short positions or long exits considered should be sized so that a loss triggered at the invalidation level represents a small, pre-defined percentage of your total capital (e.g., 1-2%).
Fundamental Backdrop
The technical setup is framed by the current fundamental landscape:
- Central Bank Policy: The market’s expectation for interest rate cuts from major central banks has been a key driver of Gold’s rally. Any hawkish surprises could trigger profit-taking.
- USD Strength: A resurgence in the US Dollar’s strength could act as a headwind for Dollar-denominated Gold.
- Geopolitical Tensions: While providing support, the “fear premium” from geopolitical events can be unpredictable and quickly unwind.
These factors contribute to a cautious fundamental backdrop at these elevated price levels, supporting the potential for a technical pullback.
Conclusion
Gold is at a critical technical juncture, testing a strong Fibonacci resistance confluence after a powerful rally. The weight of evidence suggests a bearish resolution for a short-term corrective pullback, initially targeting $3,592. Traders should monitor for signs of rejection (e.g., bearish engulfing patterns, pin bars) at this resistance zone. Risk must be managed diligently by respecting the key invalidation level above $3,656. The reaction at the $3,592 target will be crucial for determining the depth of the potential correction.
Chart Source: TradingView
Disclaimer: This analysis is for informational and educational purposes only and does not constitute financial advice or a recommendation to buy or sell any security. All trading and investing involves significant risk, including the possible loss of your entire investment. Always conduct your own research (DYOR) and consider seeking advice from an independent financial professional before making any trading decisions.


