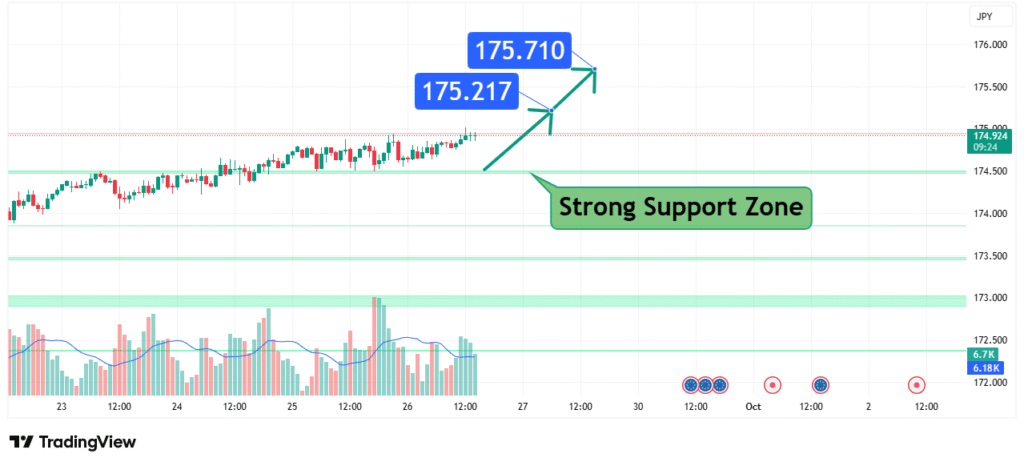
EURJPY Price Analysis Bullish Bounce from Support Targets 175.20 and 175.70
The EUR/JPY pair has declined into a defined Strong Support Zone and is showing early signs of a bullish reversal. The price action suggests buyers are defending the 174.90 level, forming a potential base for a new upward wave. Our analysis projects a move towards an initial target of 175.20, followed by a primary target at 175.70. This prediction is based on a confluence of technical factors, primarily the reaction at a key support area and the potential for a trend continuation.
Current Market Structure and Price Action
The broader market structure for EUR/JPY remains within a strong long-term uptrend but is currently undergoing a corrective pullback. This pullback has found solid ground within the identified support zone. The price is currently interacting with this zone, and the formation of bullish reversal candlestick patterns (such as hammers or bullish engulfing) on the lower timeframes would confirm buyer conviction. The current action indicates that the correction may be concluding, and the dominant uptrend is poised to resume.
Identification of the Key Support Zone
The most critical technical element on the chart is the Strong Support Zone between approximately 174.50 and 174.90.
- Historical Significance: This zone has previously acted as both support and resistance, creating a level of importance where market memory comes into play.
- Technical Confluence: The zone aligns with the 38.2% or 50% Fibonacci retracement level (not shown on provided chart but a common technique) of the previous upward leg, adding significant technical weight.
- Market Psychology: This area represents a point where trend-following sellers begin to take profits, and value-seeking buyers re-enter the market, believing the long-term trend is still intact.
This confluence makes it a high-probability level for a bullish reaction.
Technical Target(s) and Rationale
Our analysis identifies two distinct price targets.
- Initial Target (IT): 175.20
Rationale: This level represents the most recent minor swing high. A break above this level would provide the first technical confirmation that the short-term downtrend has been broken and that bullish momentum is building. - Primary Target (PT1): 175.70
Rationale: This is the more significant target, representing the recent multi-week high. A move to this level would constitute a full retracement of the recent pullback, effectively resetting the bullish trend and potentially opening the path for further highs.

Prediction: We forecast that EUR/JPY will hold above the support zone and initiate a bullish wave, first challenging the initial target at 175.20 before attempting to reach the primary target at 175.70.
Risk Management Considerations
A professional strategy is defined by its risk management.
- Invalidation Level (Stop-Loss): The entire bullish thesis is invalidated if the price breaks down and achieves a sustained 4-hour or daily close below the support zone, specifically below 174.50. This level would indicate a failure of the support and a likely continuation of the corrective move downward.
- Position Sizing: Any positions taken should be sized so that a loss triggered at the 174.50 invalidation level represents a small, pre-defined percentage of your total capital (e.g., 1-2%).
Fundamental Backdrop
The technical setup is framed by the current fundamental landscape between the Euro and the Japanese Yen:
- Bank of Japan (BoJ) Policy: The JPY remains highly sensitive to any hints of a shift away from the BoJ’s ultra-accommodative monetary policy (negative interest rates). Dovish commentary tends to weaken the JPY, benefiting EUR/JPY.
- European Central Bank (ECB) Stance: Hawkish rhetoric from the ECB regarding interest rates can strengthen the Euro, providing a tailwind for the pair.
- Risk Sentiment: EUR/JPY often acts as a barometer for risk appetite. A positive “risk-on” environment in global markets typically leads to a stronger EUR/JPY, as traders sell the safe-haven JPY.
Conclusion
EUR/JPY is testing a critical technical support zone. The weight of evidence suggests a bullish resolution is likely, targeting a move first to 175.20 and then towards 175.70. Traders should monitor for a confirmed break above the immediate resistance levels with accompanying momentum. Risk must be managed diligently by respecting the key invalidation level at 174.50. The reaction at the 175.70 target will be crucial for determining the next major directional move.
Chart Source: TradingView
Disclaimer: This analysis is for informational and educational purposes only and does not constitute financial advice or a recommendation to buy or sell any security. All trading and investing involves significant risk, including the possible loss of your entire investment. Always conduct your own research (DYOR) and consider seeking advice from an independent financial professional before making any trading decisions.


