Implied Volatility What It Is and How Traders Use It
Implied volatility (IV) is the market’s forecast of a stock’s likely movement, distilled into a single percentage. It’s the core component of an option’s price, reflecting collective sentiment about future risk and opportunity. For traders in the US, UK, Canada, and Australia, mastering IV is essential for navigating markets like the NYSE, NASDAQ, and LSE, as it provides a quantifiable measure of market fear and greed.
Summary Table
| Aspect | Detail |
|---|---|
| Definition | The market’s predicted magnitude of an asset’s future price movements, as implied by its options prices. |
| Also Known As | IV |
| Main Used In | Options Trading, Derivatives Markets |
| Key Takeaway | High IV suggests large expected price swings (more expensive options), while low IV suggests calm (cheaper options). |
| Formula | Calculated using option pricing models like Black-Scholes (No single “IV =” formula). |
| Related Concepts |
What is Implied Volatility
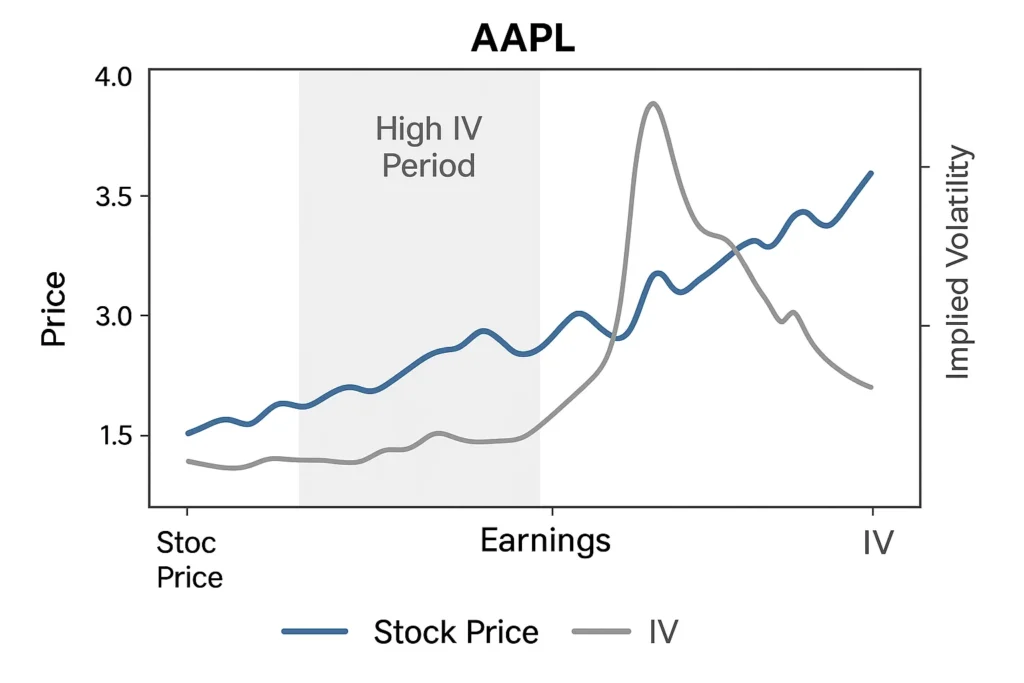
Implied Volatility is best understood as the “temperature” of the market’s expectations. It doesn’t predict the direction of a move (up or down), but rather the magnitude or the likely size of the move. It is “implied” because it is derived directly from the current market price of an option using a model like Black-Scholes.
Think of it as an insurance premium. Before a forecasted hurricane, the cost of hurricane insurance skyrockets because the expected risk of damage is high. Similarly, before a major earnings report or Fed announcement, implied volatility rises, making options more expensive, because the market expects a potential “storm” of price movement.
Key Takeaways
The Core Concept Explained
IV measures the market’s expectation of how far an asset’s price will deviate from its current price over a specific period. It is the market’s consensus on future uncertainty.
- High Implied Volatility: Recommends the market expects major price swings. This is common before major news events (earnings, FDA approvals), during geopolitical turmoil, or in bear markets. Options are priced higher to compensate sellers for the increased risk.
- Low Implied Volatility: Suggests the market expects minimal price movement. This is typical during calm, steady bull markets or in non-volatile stocks. Options are cheaper as the expected risk is lower.
How to Calculate Implied Volatility
There is no simple, standalone formula for Implied Volatility. Instead, it is calculated backwards using an options pricing model. The most famous is the Black-Scholes model.
The Black-Scholes formula calculates a theoretical option price. To find IV, we input all the known variables, the market price of the stock, the strike price, time to expiration, the risk-free interest rate, and the actual market price of the option, and then solve for the volatility variable that makes the model’s price match the market price. This solved-for value is the Implied Volatility.
Formula (Black-Scholes for a Call Option):
C = S * N(d1) – K * e^(-rt) * N(d2)
(Where C is the call option price, S is the current stock price, K is the strike price, t is time to expiration, r is the risk-free rate, and N is the cumulative distribution function of the standard normal distribution. The volatility σ is the implied volatility we solve for).
Step-by-Step Calculation Guide
In practice, traders don’t calculate this by hand. It’s done iteratively by trading software and platforms.
- Gather Inputs: You need the current market data for the option and the underlying stock.
- Plug into Model: The software uses the Black-Scholes (or a similar) model.
- Iterate: The software repeatedly adjusts the volatility input until the model’s theoretical price matches the real-world market price of the option.
- Output: The volatility value that creates this match is the Implied Volatility.
Example Calculation (Conceptual):
Let’s say a US-based company like Microsoft (MSFT) is trading at $300 per share. An at-the-money call option with 30 days to expiration is trading at a market price of $15.
| Input Values | Amount (USD) |
|---|---|
| Stock Price (S) | $300 |
| Strike Price (K) | $300 |
| Time to Expiration (t) | 30 days |
| Risk-Free Rate (r) | 5% |
| Market Option Price (C) | $15 |
The trading platform would run an iterative process:
- If it tries IV = 20%, the model might output a price of $10. Too low.
- If it tries IV = 40%, the model might output a price of $18. Too high.
- It finds that with IV = 35%, the model price equals the market price of $15.
Interpretation: The market is implying an annualized volatility of 35% for MSFT over the next 30 days.
Why Implied Volatility Matters to Traders and Investors
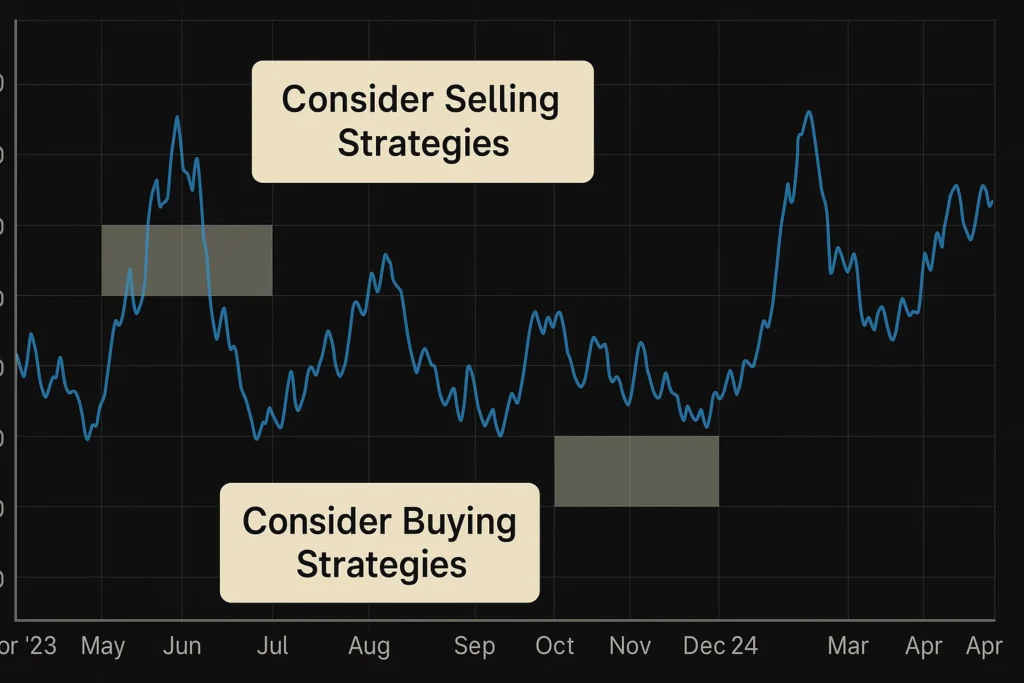
- For Options Traders: IV is fundamental to strategy selection. Selling options (e.g., selling credit spreads) is generally favored when IV is high because you collect larger premiums. Buying options (e.g., long calls/puts) is more attractive when IV is low, as you’re purchasing “cheap” insurance or lottery tickets.
- For Investors: While long-term investors may not trade options, monitoring IV can signal market sentiment. Extremely high IV across the market (as measured by the VIX index) can indicate panic and potential buying opportunities, while very low IV can suggest complacency.
- For Analysts: IV provides a market-based measure of risk for a specific company. A spike in a single stock’s IV can signal that the market is pricing in a significant upcoming event, such as a lawsuit outcome or a product launch.
Implied Volatility and the Greeks: The Vega Connection
While Delta and Theta get most of the attention, Vega is the Greek that directly measures an option’s sensitivity to changes in Implied Volatility.
- What is Vega? Vega tells you how much an option’s price is expected to change for every 1% point change in Implied Volatility. A Vega of 0.10 means the option’s price will move by $0.10 for every 1% move in IV.
- Long Options have Positive Vega: If you buy a call or put, you are “long Vega.” You want IV to increase before you sell the option, as this will increase its value, all else being equal.
- Short Options have Negative Vega: If you sell a call or put, you are “short Vega.” You want IV to decrease, as this will erode the option’s value, allowing you to purchase it back discounted or let it end worthless.
Why it adds value: This bridges the gap between understanding IV in theory and seeing its direct, quantifiable impact on your portfolio’s P&L through the Greeks.
How to Use Implied Volatility in Your Strategy
Use Case 1: Selling Premium in High IV Environments
- Scenario: A biotech stock has IV in the 90th percentile ahead of a key drug trial result. You believe the news will be positive, but not explosive enough to justify the sky-high option prices.
- Action: You could sell a put credit spread, collecting a large premium due to the high IV. Your profit is maximized if the stock stays above your short strike, and the high premium provides a larger cushion.
Use Case 2: Buying Options in Low IV Environments
- Scenario: A blue-chip stock like Johnson & Johnson (JNJ) has been trading sideways for months, and its IV is in the 20th percentile (historically low). You anticipate a breakout due to an upcoming earnings report.
- Action: You might buy a long call option. Because IV is low, the option is relatively cheap, giving you leveraged upside potential without paying a high “volatility premium.”
Visual Aid Description: A screenshot from a platform like Thinkorswim or TradingView showing the IV Rank or IV Percentile study on a chart. Annotate areas where IV is historically high (e.g., above 80%) with a “Consider Selling Strategies” label and areas where IV is historically low (e.g., below 20%) with a “Consider Buying Strategies” label.
(Image: Annotated chart from a trading platform showing IV Rank and suggesting strategy based on high or low readings.)
To start analyzing Implied Volatility on your charts, you need a robust trading platform. We’ve reviewed the best brokers for advanced options trading to help you find the right tools.
Implied Volatility Across Time and Strikes: The Volatility Surface
Advanced traders don’t look at a single IV number. They analyze the Volatility Surface, a 3D plot showing how IV changes for different expiration dates (the term structure) and different strike prices (the volatility skew/smile).
- Term Structure: Often, IV is higher for near-term expirations due to imminent events (like earnings) and lower for longer-dated ones. Sometimes this can invert, with longer-dated options having higher IV, signaling persistent long-term uncertainty.
- Volatility Skew: In equity markets, out-of-the-money (OTM) put options often have higher IV than OTM call options at a similar distance from the stock price. This “skew” reflects the market’s greater fear of a crash than of a rally, investors are willing to pay more for crash protection.
- Forward-Looking: Provides a market-based forecast of future risk, unlike historical volatility which looks backward.
- Strategy Foundation: Enables sophisticated options strategies like iron condors and calendars that rely on volatility forecasts.
- Sentiment Gauge: Acts as a direct quantifier of market fear and greed for a specific stock or the overall market (VIX).
- Not a Directional Indicator: IV tells you nothing about whether the price will go up or down, only how much it might move.
- Model-Dependent: The calculated IV is only as good as the model used (e.g., Black-Scholes has its own assumptions and limitations).
- Can Be “Wrong”: The market’s implied forecast is not always correct. IV can be too high or too low relative to the actual volatility that materializes.
Implied Volatility in the Real World: The GameStop (GME) Saga
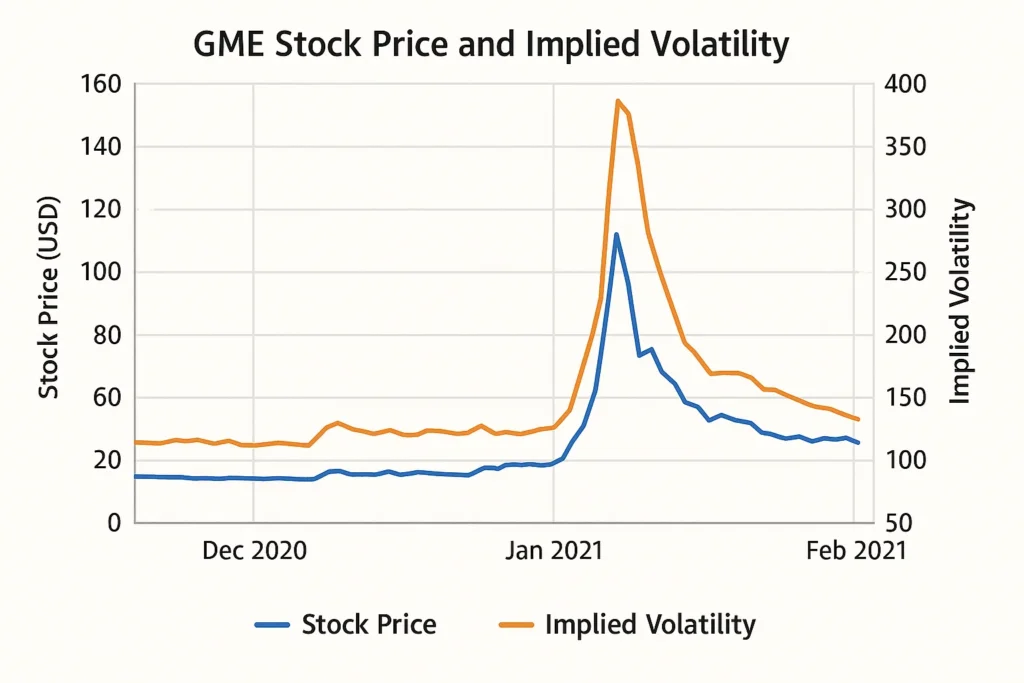
The GameStop short squeeze of January 2021 is a perfect case study of Implied Volatility in action. As the stock price began its meteoric rise, fueled by a social media frenzy, uncertainty and fear reached a fever pitch.
- The Setup: Hedge funds were massively short the stock, while retail traders were buying en masse. The outcome was wildly unpredictable.
- The IV Reaction: The implied volatility of GME options exploded. At its peak, the IV for short-dated options exceeded 500% annualized. This meant the market was pricing in a near-certainty of colossal daily price swings.
- The Implication: Buying a GME call option at this time was incredibly expensive. A small move in the stock price might not even be enough to profit because the option was so inflated by the massive IV premium. This environment was ideal for option sellers willing to take on the extreme risk for astronomical premiums.
Conclusion
Ultimately, understanding Implied Volatility provides a critical framework for evaluating risk and opportunity in the options market. While it is a powerful tool for assessing whether options are cheap or expensive and for selecting the right strategy, it is not a crystal ball and should be used in conjunction with technical and fundamental analysis. By incorporating IV analysis into your overall approach, looking at IV percentiles and ranks on your platform, you can make more informed, strategic decisions that account for the market’s own expectations of future turbulence.
Ready to trade with volatility in mind? The right brokerage is key. We’ve meticulously reviewed and ranked the best online brokers for active traders to help you execute these strategies effectively.
How Implied Volatility Relates to Other Concepts
The most common point of confusion is between Implied and Historical Volatility.
| Feature | Implied Volatility (IV) | Historical Volatility (HV) |
|---|---|---|
| What it measures | The market’s forecast of future price movement. | The actual price movement observed in the past. |
| Time Horizon | Forward-looking. | Backward-looking. |
| Formula | Derived from an options pricing model. | Calculated from the standard deviation of past price returns. |
| Primary Use | Pricing options and gauging future risk. | Understanding how volatile an asset has recently been. |
Related Terms
- The Greeks: Vega, specifically, determines an option’s sensitivity to fluctuations in Implied Volatility.
- VIX Index: The CBOE Volatility Index (VIX) is the most famous measure of the stock market’s expectation of volatility, derived from S&P 500 index options.
- Volatility Smile/Skew: A pattern that shows how IV varies for options with different strike prices, revealing market sentiment about potential tail risks.
- IV Rank/Percentile: Tools that show current IV relative to its own history over the past year, helping traders identify if IV is truly “high” or “low.”
