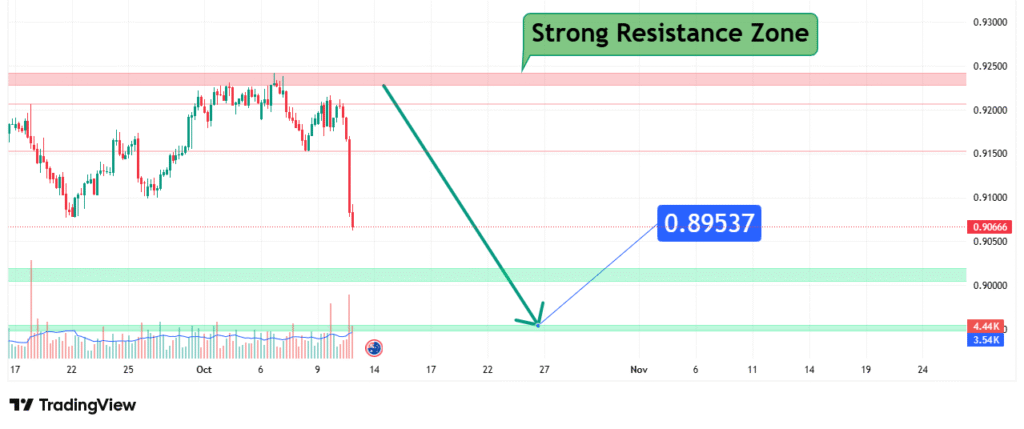
AUDCAD Price Analysis Bullish Breakout Targets 0.895
AUDCAD’s price has executed a decisive and strong breakout above a significant multi-month resistance zone circa 0.8900. This decisive price action confirms a robust bullish bias is in control. Our analysis projects a continued move upwards towards a primary target of 0.895. This prediction is based on a confluence of technical factors, primarily the successful resolution of a prolonged consolidation and the emergence of the former resistance as new support.
Current Market Structure and Price Action
The market structure has transitioned from a prolonged consolidation to a clear bullish breakout. The price was contained within a range, with a strong resistance zone at 0.8900 acting as a ceiling throughout October and November. The recent powerful bullish candle(s), breaking above this zone with conviction (a move of 3.54% from the breakout point), indicates strong buying pressure. The price is now trading well above this former barrier, which is now expected to act as support.
Identification of the Key Support Zone (Former Resistance)
The most critical technical element is the Strong Support Zone around 0.8880 – 0.8920. The strength of this zone is derived from:
- Historical Significance: This level was a formidable resistance zone for over two months. The market’s memory is strong at this level, and a successful retest would confirm a classic “resistance turned support” scenario, a highly reliable bullish signal.
- Technical Confluence: The zone aligns with the 0.89537 level (likely a Fibonacci retracement or projection) and the key psychological level of 0.8900, adding to its technical significance.
- Market Psychology: The breakout has trapped sellers and shaken out weak hands. Any pullback to this area is likely to be seen as a “discount” by bulls who missed the initial breakout, creating a fresh wave of demand.
This confluence makes it a high-probability level for a bullish reaction on any retest.
Technical Target and Rationale
Our analysis identifies the following price target:
- Primary Target (PT1): 0.895
- Rationale: This level is a clear technical target, corresponding to the 0.89537 level marked on the chart. It represents the next significant technical hurdle and a logical profit-taking zone following the initial breakout. A move to this level would represent a total rally of approximately 4.41% from the recent lows.

Prediction: We forecast that the price will sustain its bullish momentum, potentially after a retest of the new support zone, and advance towards our primary target at 0.895.
Risk Management Considerations
A professional strategy is defined by its risk management.
- Invalidation Level (Stop-Loss): The entire bullish thesis is invalidated if the price achieves a decisive daily close below the key support zone, specifically below 0.8850. This level represents a clear failure of the “support turned resistance” principle and a break back into the prior consolidation range, signaling a false breakout.
- Position Sizing: Any long positions taken should be sized so that a loss triggered at the 0.8850 invalidation level represents a small, pre-defined percentage of your total capital (e.g., 1-2%).
Fundamental Backdrop
The technical setup is framed by the current fundamental landscape:
- Commodity Correlation: Both the AUD and CAD are commodity-linked currencies, heavily influenced by the prices of iron ore (AUD) and crude oil (CAD). A rally in iron ore prices or a downturn in oil prices can provide fundamental tailwinds for this bullish AUDCAD setup.
- Central Bank Divergence: The monetary policy outlook from the Reserve Bank of Australia (RBA) and the Bank of Canada (BoC) is critical. A more hawkish stance from the RBA relative to the BoC, or expectations thereof, would provide a fundamental foundation for the pair’s ascent.
Conclusion
AUDCAD has undergone a significant technical shift, breaking free from its multi-month range. The weight of evidence, based on the powerful breakout and the “support turned resistance” principle, suggests a bullish continuation, targeting a move to 0.895. Traders could look for entry opportunities on a pullback towards the 0.8900 support zone or on a continuation of momentum. Risk must be managed diligently by respecting the key invalidation level below 0.8850. The price action at the 0.895 target will be crucial for determining if the rally has further legs.
Chart Source: TradingView
Disclaimer: This analysis is for informational and educational purposes only and does not constitute financial advice or a recommendation to buy or sell any security. All trading and investing involves significant risk, including the possible loss of your entire investment. Always conduct your own research (DYOR) and consider seeking advice from an independent financial professional before making any trading decisions.


