S Network (S) Price Analysis Bullish Reversal Targeting $0.224
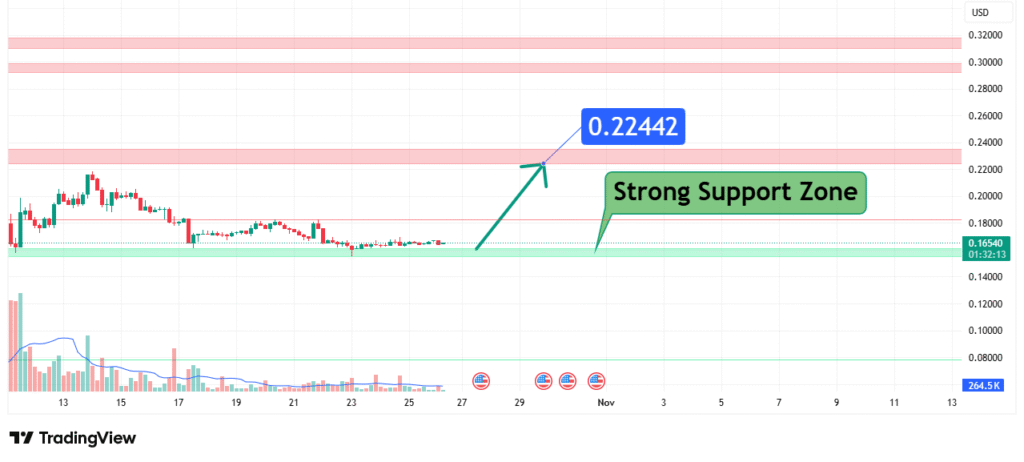
S’s price has been trading near a significant support level around $0.165, showing signs of potential exhaustion from the prior downtrend. This price action suggests a bullish bias is forming for a corrective rebound. Our analysis projects a move towards a primary target of $0.224, a level that constitutes a strong support-turned-resistance zone. This prediction is based on a confluence of technical factors, including a key historical support hold and bullish divergence signals from the MACD indicator.
Current Market Structure and Price Action
The current market structure for S is bearish in the higher timeframe but shows early signs of a potential bullish correction. The price is currently interacting with a vital support level at $0.16540, which has held firm on recent tests. The consolidation and formation of potential reversal candlestick patterns at this level, coupled with the MACD showing a potential bullish divergence (where price makes a lower low, but MACD does not), indicate that a rebound or rally may be imminent. A break above the local resistance near $0.192 would be the first confirmation of this shift.
Identification of the Key Support Zone
The most critical technical element currently is the Strong Support Zone between $0.165 and $0.170. The strength of this zone is derived from:
- Historical Significance: The level at $0.16540 has acted as a precise swing low, providing a floor for the price on multiple recent occasions. This repeated defense confirms its importance.
- Technical Confluence: This support zone aligns with a clear price level where buying pressure has historically emerged. Holding this level is crucial for any bullish short-term outlook.
- Market Psychology: This area represents a point where sellers may be exhausted, and long-term believers or value-seeking traders are likely to step in, creating a potential springboard for a price recovery.
Technical Target(s) and Rationale
Our analysis identifies the following price target:
Primary Target (PT1): $0.224
This level represents a former Strong Support Zone that is now expected to act as a significant resistance. Throughout the chart’s history, the area around $0.224 was a key battleground between buyers and sellers. A rally from the current deep oversold conditions would logically target this previous consolidation zone. A move to this level from the current price of ~$0.165 represents a potential gain of approximately 35%.

Prediction: We forecast that the price will hold the $0.165 support and initiate a bullish rebound towards PT1 at $0.224. The reaction of the price at this former support, now resistance, will be critical in determining if S can develop a more sustained recovery.
Risk Management Considerations
A professional strategy is defined by its risk management.
- Invalidation Level (Stop-Loss): The entire bullish thesis is invalidated if the price achieves a daily close below the strong support zone, specifically below $0.160. A break below this level would signal a failure of the key support and likely lead to a continuation of the downtrend, making the $0.224 target unachievable in the near term.
- Position Sizing: Any long positions taken should be sized so that a loss triggered at the $0.160 invalidation level represents a small, pre-defined percentage of your total capital (e.g., 1-2%).
Fundamental Backdrop
The technical setup is framed by the current fundamental landscape:
- Broader Crypto Market Health: As a smaller-cap altcoin, S’s price is highly sensitive to the overall sentiment in the cryptocurrency market. A bullish turn in major assets like Bitcoin and Ethereum would provide a strong tailwind for this prediction.
- S Network Developments: Any positive news regarding network upgrades, partnership announcements, or increased adoption within the S ecosystem could serve as a fundamental catalyst for the projected price increase.
- Trading Volume: An increase in buying volume on the rebound from the $0.165 support would provide strong confirmation of buyer conviction and increase the probability of the target being reached.
Conclusion
S Network is at a critical technical support level. The weight of evidence, including the hold at $0.165 and bullish momentum divergence, suggests a bullish corrective resolution, targeting a move to the $0.224 resistance zone. Traders should monitor for a confirmed bounce from current levels and manage risk diligently by respecting the key invalidation level at $0.160. The reaction at the $0.224 target will be crucial for determining the next major directional move.
Chart Source: TradingView
Disclaimer: This analysis is for informational and educational purposes only and does not constitute financial advice or a recommendation to buy or sell any security. All trading and investing involves significant risk, including the possible loss of your entire investment. Always conduct your own research (DYOR) and consider seeking advice from an independent financial professional before making any trading decisions.


