What Are Bollinger Bands and How Traders Use Them
Bollinger Bands are a powerful technical analysis tool created by John Bollinger that map volatility and relative price levels. They consist of a moving average and two outer bands that dynamically widen and contract based on market conditions. For active traders in the US, UK, Canada, and Australia, mastering Bollinger Bands is essential for identifying potential breakouts, trend reversals, and overbought or oversold conditions in markets like the NASDAQ, FTSE, and ASX.
Summary Table
| Aspect | Detail |
|---|---|
| Definition | A volatility indicator consisting of a middle moving average flanked by two standard deviation-based bands. |
| Also Known As | BB, BBands |
| Main Used In | Stock Trading, Forex, Crypto, Futures, Swing Trading, Day Trading |
| Key Takeaway | Bollinger Bands define high and low on a relative basis, helping to identify momentum and potential price reversals, but are not a standalone signal. |
| Formula |
Middle Band = 20-period SMA Upper Band = Middle Band + (2 × 20-period Standard Deviation) Lower Band = Middle Band − (2 × 20-period Standard Deviation) |
| Related Concepts |
What are Bollinger Bands
Bollinger Bands are a versatile technical analysis tool that visually represents market volatility and price levels relative to recent history. Think of them as dynamic support and resistance lines that adapt to the market’s behavior. When the market is volatile, the bands expand; when it’s quiet, they contract. This unique feature allows traders to see not just where the price is, but the context of the volatility surrounding it.
A simple analogy is a rubber band. Prices tend to return to the middle (the moving average), just as a stretched rubber band snaps back. The further price moves towards one band, the more stretched the market is, suggesting a potential snapback or reversal is more likely.
Key Takeaways
The Core Concept Explained
At its core, Bollinger Bands answer two key questions: Is the market volatile or quiet? and Are prices high or low on a relative basis? The tool uses a statistical concept called standard deviation to measure volatility. A high standard deviation means prices are spread out (high volatility), so the bands widen. A low standard deviation means prices are tight (low volatility), so the bands contract.
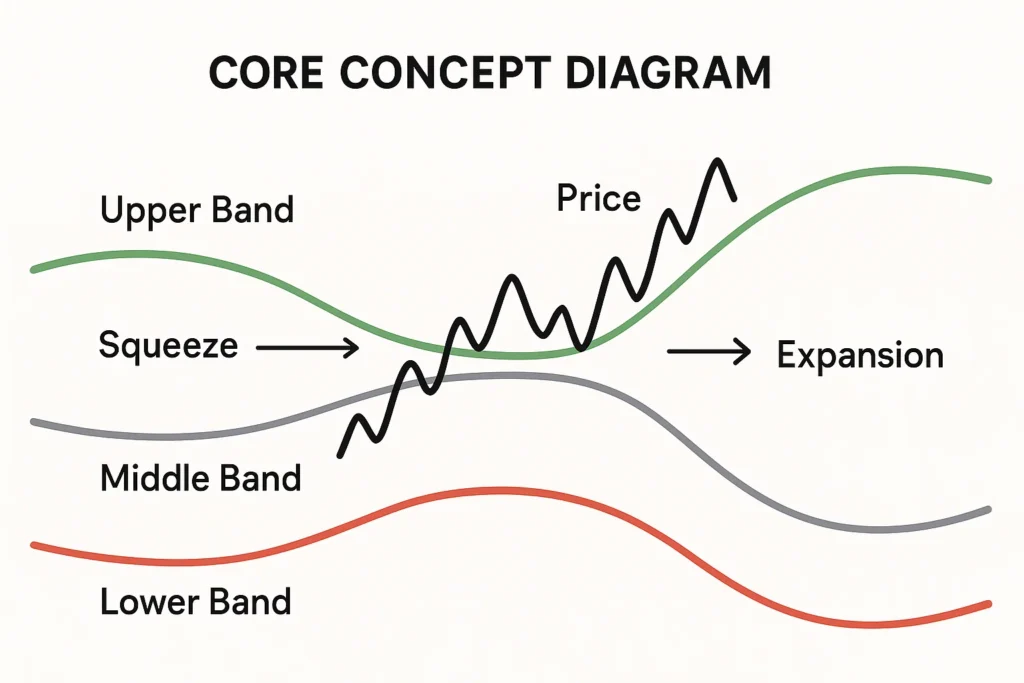
The most powerful insights come from observing the interaction between price and the bands:
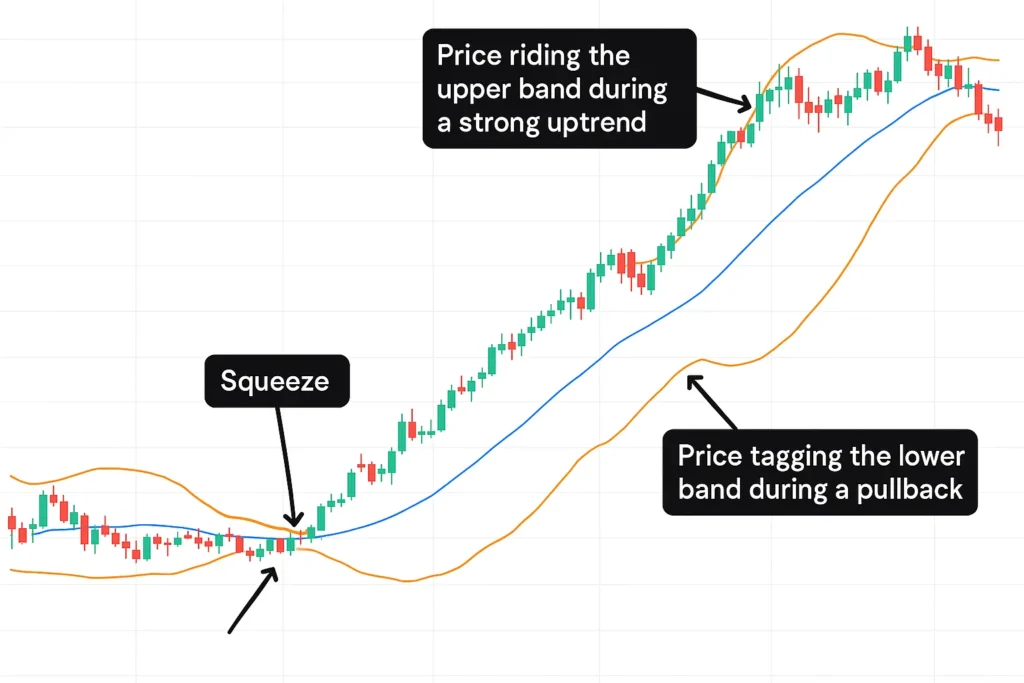
- Price touching the Upper Band: Suggests the asset is potentially overbought, but in a strong trend, it can simply indicate sustained momentum.
- Price touching the Lower Band: Suggests the asset is potentially oversold, but in a strong downtrend, it can indicate continued selling pressure.
- The Squeeze: When the bands come very close together, it signals extremely low volatility. This is often a coiled spring, foreshadowing a sharp price move (a breakout) in either direction.
How to Calculate Bollinger Bands
The standard calculation for Bollinger Bands uses a 20-period Simple Moving Average (SMA) and two bands set two standard deviations above and below it.
Formulas:
- Middle Band = 20-period Simple Moving Average (SMA)
- Upper Band = 20-period SMA + (2 * 20-period Standard Deviation)
- Lower Band = 20-period SMA – (2 * 20-period Standard Deviation)
Step-by-Step Calculation Guide
Let’s break down the components and walk through an example.
Components:
- Period: Typically 20, meaning it calculates based on the last 20 closing prices.
- Simple Moving Average (SMA): The average of the last 20 closing prices.
- Standard Deviation: A statistical measure of how spread out the prices are from the average. A higher number means more volatility.
Example Calculation:
Let’s calculate the final data point for a stock. Assume the last 20 closing prices give us the following:
| Input Value | Calculation |
|---|---|
| 20-period SMA = $150 | This is the Middle Band. |
| 20-period Standard Deviation = $5 | This measures recent volatility. |
| Upper Band | $150 + (2 * $5) = $160 |
| Lower Band | $150 – (2 * $5) = $140 |
Interpretation: For this final price point, the Bollinger Bands would be plotted at $160 (Upper), $150 (Middle), and $140 (Lower). A current price of $158 would be very close to the upper band, suggesting the stock is trading at a relatively high level compared to the last 20 periods.
Why Bollinger Bands Matter to Traders and Investors
Bollinger Bands matter because they turn abstract volatility into a concrete, visual tool for decision-making.
- For Traders: They provide clear, visual cues for potential entry and exit points. A trader might sell when price touches the upper band in a ranging market or buy when it bounces off the lower band. The squeeze alerts them to prepare for a potential breakout trade.
- For Investors: While not a primary tool for long-term investors, Bollinger Bands can help identify attractive entry points during market pullbacks. An investor might see a dip that pushes the price to or below the lower band as a potential buying opportunity in an otherwise strong stock.
- For Analysts: They offer a quantifiable way to assess market sentiment and volatility cycles, which can be factored into broader market analysis and forecasting models.
How to Use Bollinger Bands in Your Strategy
Here are two of the most common and actionable strategies using Bollinger Bands.
Use Case 1: The Bollinger Band Squeeze (Breakout Strategy)
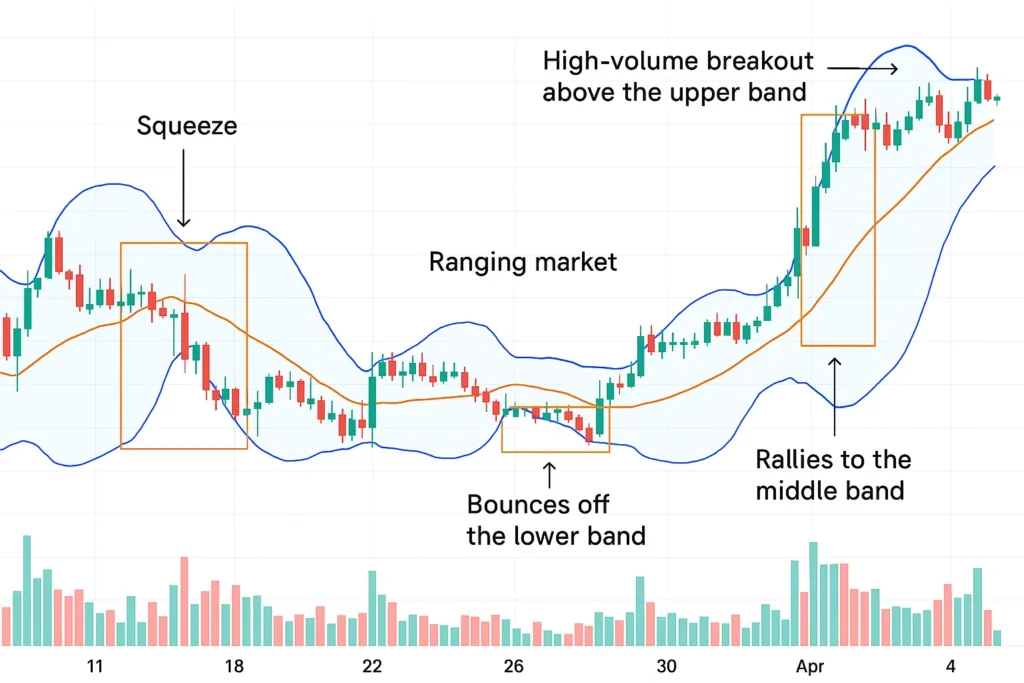
This strategy capitalizes on periods of low volatility. When the bands squeeze tightly, it indicates consolidation. The subsequent breakout of either band often signals the start of a new trend.
- Action: Place a buy order above the upper band or a sell order below the lower band once the squeeze occurs. The move is often powerful and sustained.
- Confirmation: Use high volume on the breakout to confirm the move’s strength. A tool like the On Balance Volume (OBV) indicator is perfect for this.
Use Case 2: The Bollinger Bounce (Mean Reversion Strategy)
In a ranging or sideways market, price tends to revert to the mean (the middle band). This strategy fades the extremes.
- Action: When price touches or crosses the upper band, it could be a signal to sell or short, with a profit target near the middle band. Conversely, when price touches the lower band, it could be a signal to buy, with a profit target at the middle band.
- Confirmation: Use a momentum oscillator like the Relative Strength Index (RSI) to confirm. For example, if price touches the lower band and the RSI is below 30 (oversold), it strengthens the buy signal.
To start identifying these squeezes and bounces on live markets, you need a brokerage platform with advanced charting capabilities. We’ve reviewed the best platforms for active traders to help you choose.
Advanced Strategy: The Bollinger Band / RSI Combo for High-Probability Trades
While using Bollinger Bands alone can be effective, combining them with other indicators creates a powerful, multi-factor confirmation system. One of the most reliable setups pairs Bollinger Bands with the Relative Strength Index (RSI). This strategy, often called The BB/RSI Combo, helps filter out false signals and pinpoint high-probability reversal points, especially in ranging markets.
The Core Concept: Volatility + Momentum
The logic is straightforward:
- Bollinger Bands tell you where the price is relative to its recent range (i.e., at a relative low or high).
- RSI tells you the momentum behind the move (i.e., whether the selling or buying pressure is exhausting itself).
When both indicators align, the signal is significantly stronger.
The Bullish Reversal Confirmation
This setup is used to identify potential buying opportunities at or near market bottoms.
- Step 1 – The Bollinger Band Signal: The price must touch, cross, or come very close to the lower Bollinger Band. This identifies a potential oversold condition.
- Step 2 – The RSI Confirmation: Simultaneously, the RSI (typically set to a 14-period) must read at or below 30 (oversold) AND/OR show a Bullish Divergence. A Bullish Divergence happens when the amount makes a lower low, but the RSI makes a higher low. This indicates that selling momentum is waning even as the price continues to fall.
- Step 3 – The Entry Trigger: The actual buy signal occurs when a bullish candlestick (like a Hammer or Bullish Engulfing) forms near the lower band, and the price begins to move back inside the bands.
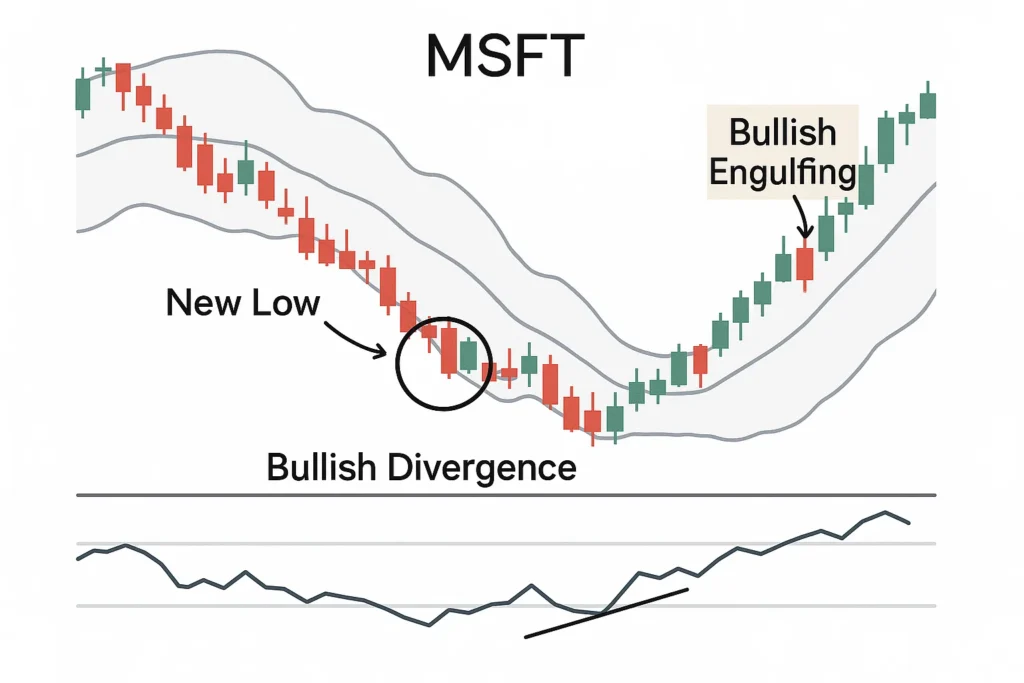
Why It Works: This setup ensures you aren’t trying to catch a falling knife. You’re only entering when both volatility (price at a relative extreme) and momentum (weakening selling pressure) are in your favor.
Executing this strategy requires a platform that allows for easy multi-indicator analysis. We’ve tested the top platforms to find the best brokers for advanced charting and fast execution.
Using BandWidth to Hunt for Opportunities
Manually scanning dozens of charts for a Bollinger Band Squeeze is inefficient. To gain a true edge, you can systematize your process using a derived indicator called BandWidth. This transforms you from a passive chart watcher into an active hunter for the market’s most coiled springs.
What is BandWidth
BandWidth is a separate, oscillating indicator that quantifies the Bollinger Band Squeeze. Its calculation is simple:
- BandWidth = (Upper Band – Lower Band) / Middle Band
This formula expresses the band width as a percentage of the middle moving average. When BandWidth is high, the bands are wide (high volatility). When BandWidth is low, the bands are narrow (low volatility)—this is the Squeeze.
The BandWidth Squeeze Scan Strategy
This is a practical workflow you can implement today on platforms like TradingView or Thinkorswim.
Create a Scanner/Screener:
- Set your scanner to find assets (stocks, ETFs, forex pairs) where the BandWidth value is at a 100-day (or 6-month) low.
- This objective, numerical filter does the hard work for you, instantly finding the tightest, most compressed charts in the market.
Analyze the Watchlist:
- The results of your scan become a high-priority watchlist. Not every squeeze will lead to a major breakout, so further analysis is needed.
- Filter by Context: Is the stock in a long-term uptrend but taking a breather? These are often the best candidates for a continuation breakout to the upside.
- Check for Precursors: Look for a period of declining volume during the squeeze, which often indicates indecision and builds potential energy.
Define Your Breakout Rules:
- Don’t guess the direction. Let the market tell you.
- Rule: Enter a long position on a decisive close above the upper Bollinger Band, preferably on above-average volume.
- Rule: Enter a short position on a decisive close below the lower Bollinger Band, preferably on above-average volume.
- Stop-Loss: Place your stop-loss just inside the opposite side of the band that was broken (e.g., for a long trade, place the stop below the middle band or the recent low within the squeeze).
To run advanced scans using indicators like BandWidth, you need a powerful platform. See our detailed review of TradingView, which offers exceptional screening tools for retail traders.
- Adapts to Volatility: Unlike fixed support/resistance lines, Bollinger Bands dynamically adjust to market conditions.
- Visual Clarity: They provide an easy-to-see picture of relative price highs and lows.
- Versatility: They can be applied to any timeframe and any liquid asset (stocks, forex, crypto).
- Multi-Purpose: They help identify trend continuations, reversals, and potential breakout points.
- Lagging Indicator: Like all indicators based on moving averages, Bollinger Bands are reactive, not predictive.
- Whipsaws in Ranging Markets: In strong trends, price can walk the band, generating false sell signals during uptrends or false buy signals during downtrends.
- Not a Standalone Tool: John Bollinger himself advocates using them with other indicators (like RSI or volume) for confirmation. Relying on them alone is risky.
- The Squeeze Doesn’t Predict Direction: The squeeze warns of an impending move but doesn’t tell you which way it will go.
Bollinger Bands in the Real World: A Case Study
A classic example of the Bollinger Band Squeeze occurred with Bitcoin (BTC) in Q4 2020. After a period of consolidation, Bitcoin’s volatility dropped significantly, causing a pronounced squeeze on the Bollinger Bands on the weekly chart. This period of low volatility, as defined by the tight bands, was the calm before the storm.
In late December 2020, BTC finally broke out above the upper band with massive volume. This was the confirmation signal. The breakout led to a historic bull run, taking Bitcoin from around $20,000 to an all-time high near $65,000 over the next several months. The squeeze provided the early warning, and the breakout provided the actionable signal.
Bollinger Bands vs Keltner Channels
Bollinger Bands are often confused with Keltner Channels, another volatility-based envelope indicator. The key difference lies in the calculation and sensitivity.
| Feature | Bollinger Bands | Keltner Channels |
|---|---|---|
| What it measures | Volatility based on Standard Deviation. | Volatility based on Average True Range (ATR). |
| Core Component | Middle 20-period SMA, Bands at 2 Std. Dev. | Middle 20-period EMA, Bands at 2× ATR. |
| Sensitivity | Less sensitive, bands react more slowly to volatility spikes. | More sensitive, bands contract and expand more rapidly. |
| Primary Use | Identifying overbought/oversold levels and breakouts from squeezes. | Often used for trend-following, as price can ride the bands more consistently. |
Conclusion
Bollinger Bands are an indispensable tool for any technically-minded trader, providing a dynamic framework for assessing volatility and identifying potential trading opportunities. As we’ve seen, their strength lies in their adaptability, but their primary limitation is that they are not a crystal ball. They should be used as part of a confluence of signals, not in isolation. By combining the insights from the Squeeze, band touches, and the middle band with other confirming indicators, you can significantly enhance your market analysis. Start by applying these concepts to your charts, and you’ll begin to see the market’s rhythm in a whole new way.
Ready to put these concepts into action? The right tools are essential. We’ve meticulously reviewed and ranked the best online brokers for technical analysis to help you get started on the right foot.
Related Terms
- Moving Average (MA): The foundation of the middle band. Understanding MAs is crucial.
- Standard Deviation: The statistical backbone of the band width calculation.
- Relative Strength Index (RSI): A perfect complementary momentum indicator to confirm Bollinger Band signals.
- MACD: A trend-following momentum indicator that can be used alongside Bollinger Bands to confirm the direction of a breakout.
Frequently Asked Questions
(Upper Band - Lower Band) / Middle Band. A low BandWidth value identifies a squeeze both visually and numerically, helping you scan multiple assets for the tightest conditions, which often lead to the most significant moves.
Recommended Resources
- John Bollinger’s official website
- Investopedia’s Bollinger Bands entry
- TradingView: It offers free charting tools with built-in Bollinger Bands
How did this post make you feel?
Thanks for your reaction!
