What Is Market Capitalization How to Evaluate, Value a Stock
Market capitalization, or market cap, is the total dollar value of a company’s outstanding shares of stock. It’s the primary measure of a public company’s size and a crucial starting point for any investment analysis, especially for investors in the US, UK, Canada, and Australia navigating major exchanges like the NYSE, NASDAQ, and LSE.
| Aspect | Detail |
|---|---|
| Definition | The total market value of a company’s outstanding shares. |
| Also Known As | Market Cap |
| Main Used In | Stock Trading, Equity Research, Portfolio Management |
| Key Takeaway | It’s a quick snapshot of company size and risk profile, not its price or asset value. |
| Formula | Market Cap = Share Price × Outstanding Shares |
| Related Concepts |
What is Market Capitalization
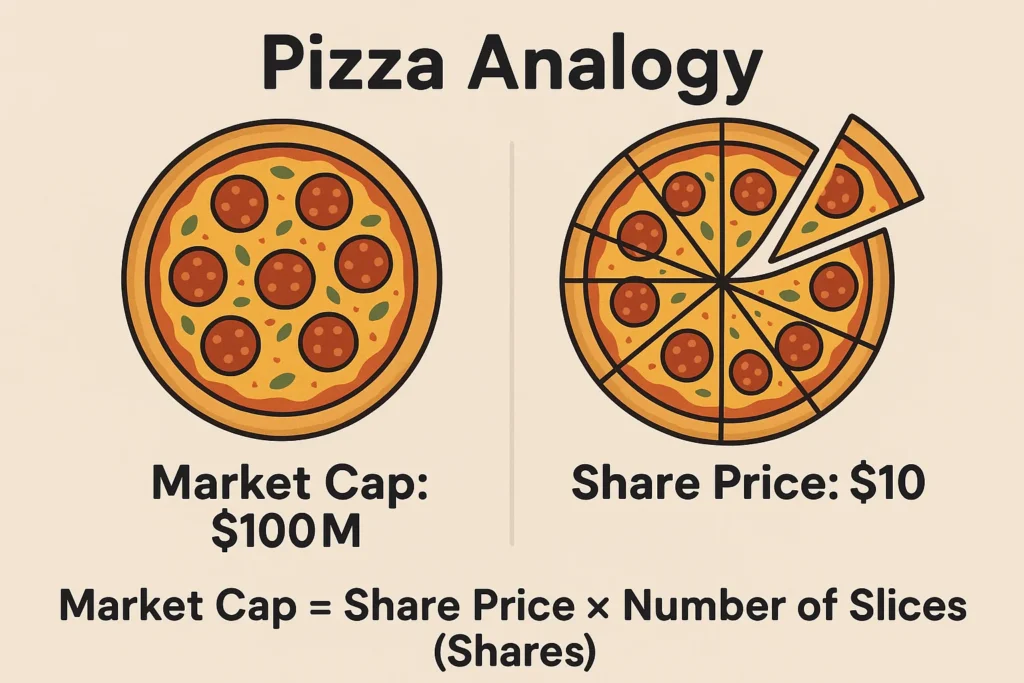
Market capitalization is the market’s collective valuation of a publicly traded company. Think of it as the price tag the stock market has placed on the entire company. It’s calculated in real-time based on the current share price and the total number of shares available for trading. A common analogy is to think of a company as a pizza. The number of slices is the total outstanding shares, and the price per slice is the share price. The market cap is the total value of the whole pizza, regardless of how it’s sliced.
Key Takeaways
The Core Concept Explained
At its core, market cap measures what the market believes a company is worth. It’s a forward-looking metric based on future earnings potential, brand value, intellectual property, and market sentiment. A high market cap indicates that investors have strong confidence in the company’s future growth and stability. Conversely, a low market cap might suggest skepticism, higher risk, or that the company is in an early growth stage. It’s important to understand that a higher stock price does not automatically mean a larger company. A company with 1 million shares at $100 has the same $100 million market cap as a company with 10 million shares at $10.
How to Calculate Market Capitalization
The formula for market capitalization is straightforward.
Market Capitalization = Present Share Price × Entire Number of Outstanding Shares
Step-by-Step Calculation Guide
Let’s break down the components:
- Current Share Price: The latest price at which a single share of the company’s stock traded. This is determined by the stock market (e.g., NASDAQ, LSE).
- Total Outstanding Shares: The total number of shares of stock that are currently held by all shareholders, including institutional investors and company insiders.
Example Calculation:
Let’s take a hypothetical company, “TechNovate,” listed on the NASDAQ.
- Input Values:
- Current Share Price: $150 (USD)
- Total Outstanding Shares: 50,000,000
- Calculation:
- Market Cap = $150 × 50,000,000 = $7,500,000,000
- Interpretation: A market cap of $7.5 billion places TechNovate firmly in the Mid-Cap category. This valuation is used by investors and analysts to compare it to other companies in its sector.
Why Market Capitalization Matters to Traders and Investors
Market cap is far more than just a number; it’s a critical filter for investment strategy.
- For Investors: It’s the foundation of asset allocation and risk management. A conservative investor might build a core portfolio with Large-Cap stocks like those in the S&P 500 for stability, while a growth-oriented investor might allocate a portion to Small-Cap stocks for higher potential returns. Understanding market cap helps in diversifying a portfolio across different risk profiles.
- For Traders: Traders use market cap to gauge a stock’s volatility and liquidity. Large-Cap stocks typically have high liquidity, making it easier to enter and exit positions. Small-Caps can be more volatile, presenting opportunities for larger short-term swings.
- For Analysts: Market cap is essential for peer comparison. Comparing the financial ratios (like P/E) of a Large-Cap company to another Large-Cap is meaningful, whereas comparing it to a Small-Cap can be misleading due to different risk and growth profiles.
A Deep Dive into Market Cap Categories
While the dollar thresholds can vary, here is a detailed breakdown of each category with examples from major global exchanges.
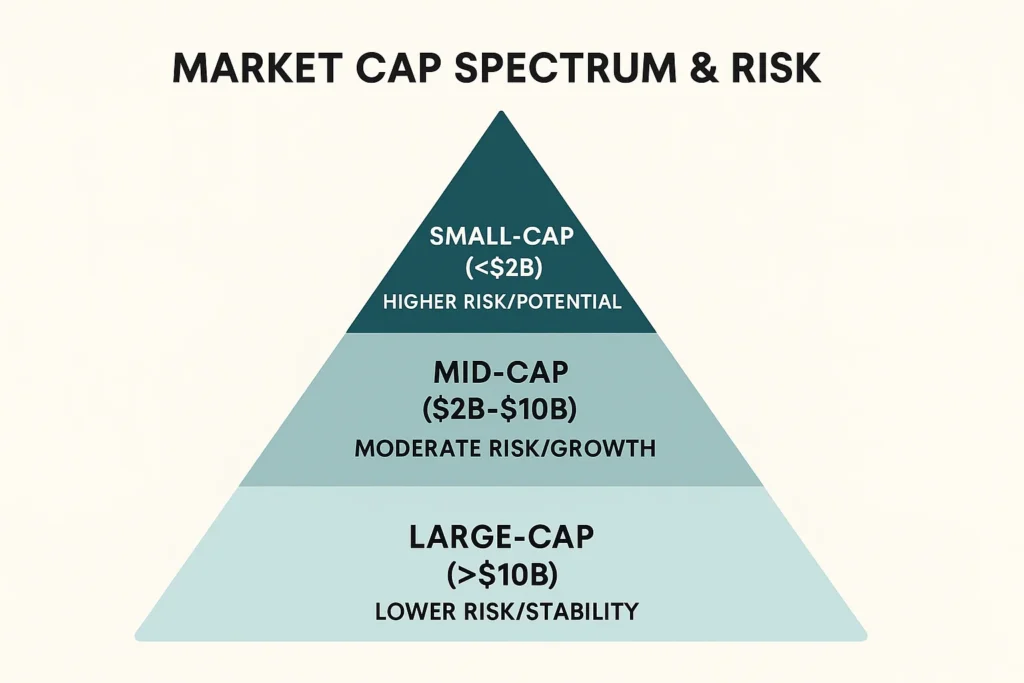
- Mega-Cap (>$200 Billion): These are the titans of industry, often global household names. They are typically less volatile and may pay dividends.
- Examples: Apple (NASDAQ: AAPL), Microsoft (NASDAQ: MSFT), Saudi Aramco (Tadawul: 2222).
- Large-Cap ($10B – $200B): Established, stable companies known as “blue chips.” They are industry leaders and form the core of many retirement portfolios.
- Examples: Coca-Cola (NYSE: KO), Toyota (TYO: 7203), HSBC (LSE: HSBA).
- Mid-Cap ($2B – $10B): These companies are in a growth phase. They offer a balance between the stability of Large-Caps and the growth potential of Small-Caps.
- Examples: Roblox (NYSE: RBLX), DocuSign (NASDAQ: DOCU).
- Small-Cap ($300M – $2B): Often younger companies or those in niche markets. They have high growth potential but are riskier, more volatile, and more vulnerable to economic downturns.
- Examples: Many companies on the ASX or the AIM in London.
- Micro-Cap ($50M – $300M) & Nano-Cap (<$50M): These are the riskiest segments, often with low liquidity and less public information. They are susceptible to manipulation and are generally unsuitable for novice investors.
How to Use Market Capitalization in Your Strategy
- Case 1: Building a Core-Satellite Portfolio: Use Large-Cap stocks (e.g., Apple, Microsoft) as the stable “core” of your portfolio (70-80%). Use Mid-Cap and Small-Cap stocks as “satellites” (20-30%) for growth potential.
- Case 2: Sector Investing with a Risk Lens: If you’re bullish on the technology sector but risk-averse, you might invest in a Large-Cap tech ETF like the Invesco QQQ Trust. For a higher-risk approach, you could seek out a Small-Cap tech ETF.
- Case 3: Screening for Stocks: Use a stock screener to filter companies by market cap. For example, you could screen for “U.S. Small-Cap stocks with a P/E ratio below 20” to find potentially undervalued growth opportunities.
To start screening stocks by market cap and other vital metrics, you need a brokerage platform with robust research tools. Explore our reviews of the Best Online Brokers for Stock Research to find the right fit for your strategy.
- Simplicity It’s easy to calculate and provides a real-time snapshot of company size.
- Risk Assessment It’s the best single metric for broadly categorizing investment risk and potential return.
- Indexing Foundation It is the backbone of passive investing through market-cap-weighted index funds and ETFs.
- Market Sentiment It captures the collective wisdom and future expectations of the entire market.
- Not True Value A company’s true takeover value is better represented by Enterprise Value (EV), which includes debt and cash.
- Volatility It can swing wildly with stock price movements, which may not reflect a change in the company’s intrinsic value.
- Ignores Debt It does not account for a company’s debt load. A highly leveraged company might have a deceptively large market cap.
- Float Consideration The basic calculation uses all shares, but “float-adjusted” market cap, which only uses publicly tradable shares, can be more accurate for liquidity.
The Role of Market Cap in Index Investing
Market capitalization is the foundation of passive investing. Most major stock indices are market-cap-weighted.
- How it Works: In a cap-weighted index like the S&P 500 or the FTSE 100, companies with a larger market cap have a greater influence on the index’s performance. For example, a 5% move in Apple’s stock price has a much larger impact on the S&P 500 than a 5% move in a much smaller company within the index.
- Implication for Investors: When you buy an S&P 500 ETF, you are not buying an equal piece of 500 companies. You are buying a portfolio that is heavily weighted towards the largest companies. This is generally effective as it reflects the market’s collective valuation, but it also means your investment is concentrated in the top holdings.
Market Capitalization in the Real World: A Case Study
The “Magnificent Seven” tech stocks (Apple, Microsoft, Alphabet, Amazon, Nvidia, Meta, Tesla) provide a perfect case study. In early 2023, these seven companies collectively reached a staggering market cap that exceeded the entire stock markets of countries like the UK, France, or Canada.
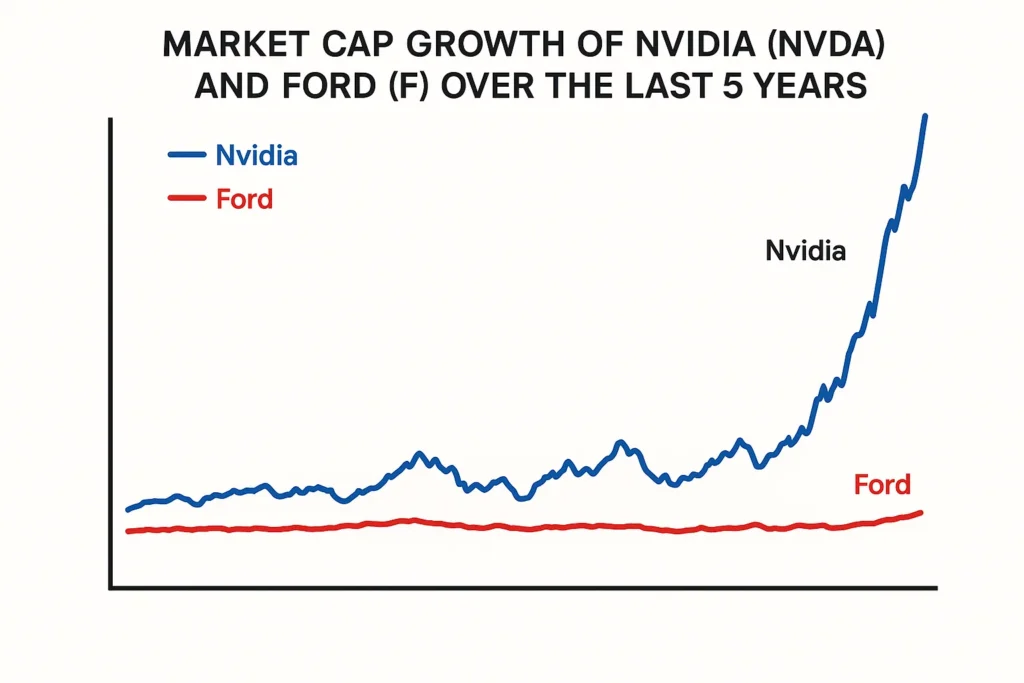
Nvidia’s Meteoric Rise: Driven by the AI boom, Nvidia’s market cap skyrocketed. In May 2023, its market cap was around $770 billion. By June 2024, it had surged past $3 trillion, briefly becoming the world’s most valuable company. This dramatic increase wasn’t due to a change in outstanding shares but a massive surge in its share price, reflecting the market’s extreme confidence in its future earnings from AI chips. This shows how market cap is a direct barometer of investor sentiment and perceived future growth.
Market Capitalization vs Enterprise Value (EV)
| Feature | Market Capitalization | Enterprise Value (EV) |
|---|---|---|
| What it measures | Equity value of the company. | Total company value, including debt and cash. |
| Represents | Value to shareholders. | Value to all investors (debt and equity holders). |
| Formula | Share Price × Outstanding Shares | Market Cap + Total Debt – Cash |
| Primary Use | Comparing company size and stock risk. | Valuing a company for acquisition (takeover price). |
Conclusion
Understanding market capitalization provides a critical first lens for evaluating any stock investment. While it is a powerful and simple tool for sizing up companies and managing portfolio risk, as we’ve seen, it’s not infallible and should be used in conjunction with other metrics like Enterprise Value and P/E ratios. By incorporating market cap into your overall strategy, you can make more informed, structured, and data-driven decisions. Start by categorizing the stocks you own or are researching into Large, Mid, and Small-Cap segments to better understand your portfolio’s risk exposure.
Ready to build a diversified portfolio based on market cap? The right brokerage is essential. We’ve meticulously reviewed and ranked the Best Online Brokers for Diversified Investing to help you get started.
Related Terms:
- Enterprise Value (EV): As shown in the table, EV provides a more complete picture of a company’s total valuation.
- Free Float: The number of shares actually available for public trading, which is used to calculate float-adjusted market cap.
- Market Cap Weighted Index: An index where each component’s weight is proportional to its market cap, like the S&P 500 or the FTSE 100.
