What is Closing Price, How to Use It for Smarter Trades
The closing price is the ending price at which a security buy and sell during a regular trading period. It serves as the most critical daily benchmark, used by millions of traders and investors worldwide to gauge market sentiment, calculate profit and loss, and track performance over time.
For active traders in the US monitoring the NYSE and NASDAQ, long-term investors in the UK analyzing the FTSE 100, or crypto enthusiasts tracking Bitcoin on exchanges like Coinbase, the closing price is the definitive daily scorecard for their portfolios.
Summary Table
| Aspect | Detail |
|---|---|
| Definition | The last traded price of a security (e.g., a stock) during a standard trading session. |
| Also Known As | Settlement Price, Daily Close |
| Main Used In | Stock Trading, Technical Analysis, Fund Valuation, Derivatives Pricing |
| Key Takeaway | It is the most widely accepted benchmark for a day’s market activity, used to calculate returns, draw charts, and assess performance. |
| Formula | N/A (Determined by the final auction or trade) |
| Related Concepts |
What is the Closing Price
The closing price is more than just the last number you see on a ticker at 4:00 PM ET. It is the official price point that summarizes the entire day’s battle between bulls and bears. Think of it as the final score in a sporting event—it doesn’t tell you the entire story of the game’s ups and downs, but it’s the only number that ultimately counts in the record books. This price is crucial for calculating daily returns, drawing technical analysis charts, and valuing portfolios at the end of each trading day. For investors tracking long-term performance, the series of closing prices over time forms the backbone of their equity curve.
Key Takeaways
The Core Concept Explained
The core concept of the closing price lies in its role as a consensus value. Throughout the day, a stock’s price fluctuates based on real-time supply and demand. The closing price is the level at which the market finally agrees to settle for the day. On modern exchanges like the NYSE and NASDAQ, this isn’t always a simple last trade. It’s often determined by a closing auction, a concentrated period in the final minutes of trading where a massive volume of buy and sell orders are matched to find a single, fair price that clears the most volume. This process helps prevent manipulation from a last-second, low-volume trade.
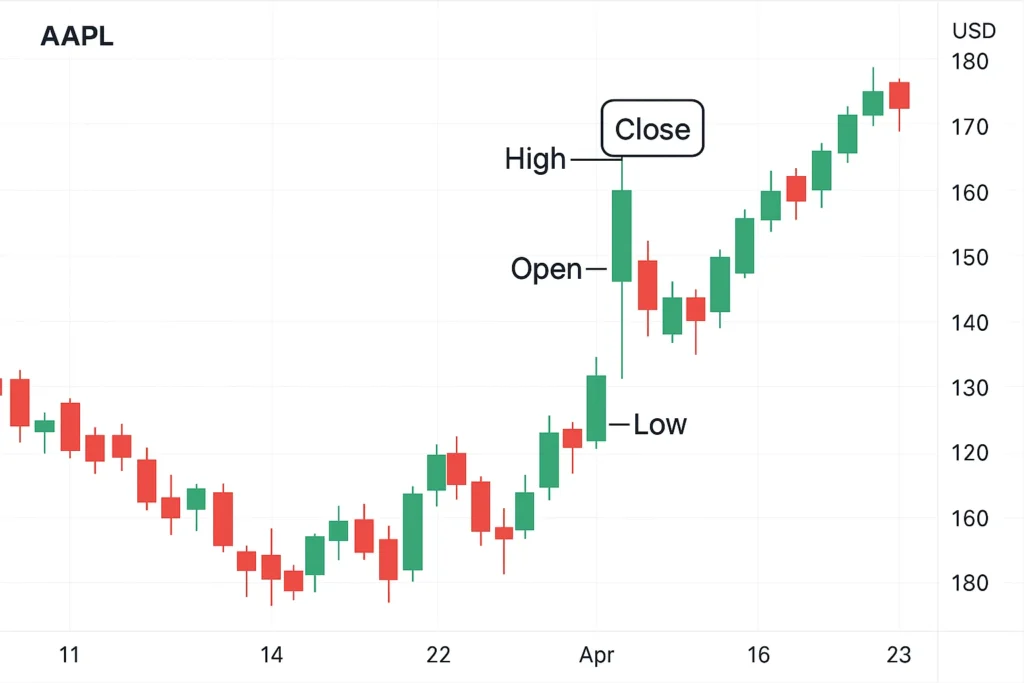
A higher close than the previous day suggests bullish sentiment, while a lower close indicates bearish sentiment. The relationship between the closing price and the day’s high and low (as seen in a candlestick) provides powerful clues about who won the day’s trading battle: the buyers or the sellers.
How is the Closing Price Determined
While it seems straightforward, the methodology behind setting the official closing price is a sophisticated process designed to ensure fairness and accuracy, especially on major Tier-1 exchanges.
The Closing Auction Process
Most major stock exchanges, including those in the US, UK, Canada, and Australia, use a closing auction or call to determine the final price. Here’s a simplified step-by-step:
- Trading Halt: Regular continuous trading pauses shortly before the official close (e.g., at 3:50 PM ET on the NYSE).
- Order Collection: For a period of about 10 minutes, the exchange collects all market-on-close (MOC) and limit-on-close (LOC) orders. These are orders specifically designated to execute at the closing price.
- Price Discovery: The exchange’s matching engine calculates the price at which the maximum number of shares (buy and sell orders) can be matched.
- Publication: This calculated price becomes the official closing price, and all eligible on-close orders are executed at this single price.
For a trader in London watching the LSE’s closing auction or an investor in Sydney analyzing the ASX’s final price, understanding this auction process is key to executing large orders without adversely affecting the price. Using a broker that provides advanced order types, like VWAP or Market-on-Close, is essential for institutional and serious retail investors.
The Closing Price Across Different Asset Classes
The concept of a closing price extends beyond stocks. Here’s how it works in other markets:
- Forex (Foreign Exchange): The forex market is a 24-hour market from 5 PM ET Sunday to 4 PM ET Friday. Therefore, the “closing price” is typically considered the price at 5 PM ET, which is also the “open” for the new day. This is the time used for daily candlestick calculations.
- Cryptocurrencies: Crypto markets never close, operating 24/7. Exchanges still calculate a daily closing price, usually based on the price at UTC 00:00 (midnight Coordinated Universal Time). This allows for the creation of standard daily charts.
- Futures and Options: These derivatives have specific expiration dates. The closing price on the expiration date is critically important as it is often used to determine the final settlement value for cash-settled contracts.
Why the Closing Price Matters to Traders and Investors
The closing price is the cornerstone of market analysis and portfolio management for several reasons:
- For Technical Analysts: It is the primary data point for constructing every single chart and technical indicator. From simple line charts to complex moving averages and the body of a candlestick, the closing price is the input. A core tenet of technical analysis is that the closing price is the most important price of the day, as it represents the final consensus of value.
- For Long-Term Investors: It provides a clean, daily data point to track portfolio performance and calculate returns. Mutual funds and ETFs use the closing price to calculate their daily Net Asset Value (NAV), which determines the price at which investors buy and sell fund shares.
- For Traders: It acts as a critical support or resistance level. Many traders analyze whether a stock “closed strong” (near its high) or “closed weak” (near its low) to gauge momentum for the next trading session. It’s also the reference point for setting profit targets and stop-loss orders.
- For Derivatives and Contracts: Many financial contracts, such as options and futures, are settled based on the underlying asset’s closing price on the expiration date.
How to Use the Closing Price in Your Strategy
Here are specific, actionable ways to incorporate the closing price into your market analysis:
- Case 1: Identifying Trend Strength with Closing Prices. Draw a simple line chart using only closing prices. If the line is making a series of higher peaks and higher troughs, you have a visual confirmation of an uptrend. This is often cleaner than looking at a chart with all the intraday noise.
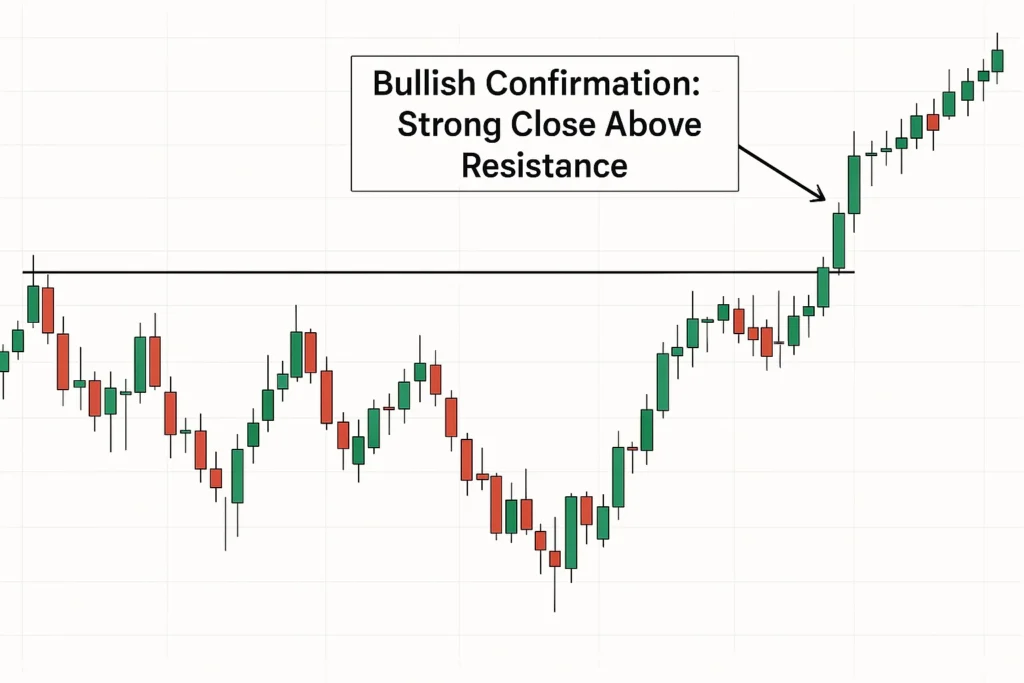
- Case 2: Using the Closing Price as a Key Level. A common strategy is to buy a stock if it manages to “close above” a significant resistance level (like a previous high). This confirms that the bulls had the strength to finish the day in control. Conversely, closing below support is a strong bearish signal.
- Case 3: Trading the “Gap.” The difference between one day’s closing price and the next day’s opening price is called a gap. Traders often watch how a stock behaves relative to its previous close. For example, if a stock gaps up at the open but then fails to hold those gains and closes below yesterday’s close, it can signal a “failed breakout” and a potential reversal.
To implement these strategies, you need a brokerage platform with robust charting tools that allow you to easily plot lines and identify key closing levels. Platforms like TradingView or those offered by major brokers like Interactive Brokers or Fidelity are excellent for this purpose.
Psychology of the Close: Why It Matters for Trader Sentiment
The final few minutes of trading often see a surge in volume. This is because the closing price “sets in stone” the day’s P&L. Traders are keen to either:
- Window Dressing: Fund managers might buy high-performing stocks at the close to make their end-of-quarter holdings look more impressive.
Squaring Off: Day traders close all their positions to avoid overnight risk, adding to the volume.
This fight for the final print can create momentum, making the close a self-fulfilling prophecy for the next day’s opening sentiment. A strong close often leads to follow-through buying the next morning.
- Universal Benchmark Provides a standardized, universally accepted point of reference for daily performance.
- Reduces Noise Filters out the intraday volatility and provides a clear, single data point for analysis.
- Foundation for Analysis Essential for calculating returns, drawing charts, and creating technical indicators.
- Reflects Final Sentiment Captures the market’s final consensus on a security’s value for the day.
- Incomplete Picture Does not show the intraday volatility or trading range, hiding the day’s true price action.
- Potential Manipulation In illiquid markets, the closing auction can be gamed by large players.
- Lagging Indicator It is a historical data point and does not predict future prices on its own.
- Can Be Misleading Relying on it alone without volume or range context can generate false signals.
Closing Price in the Real World
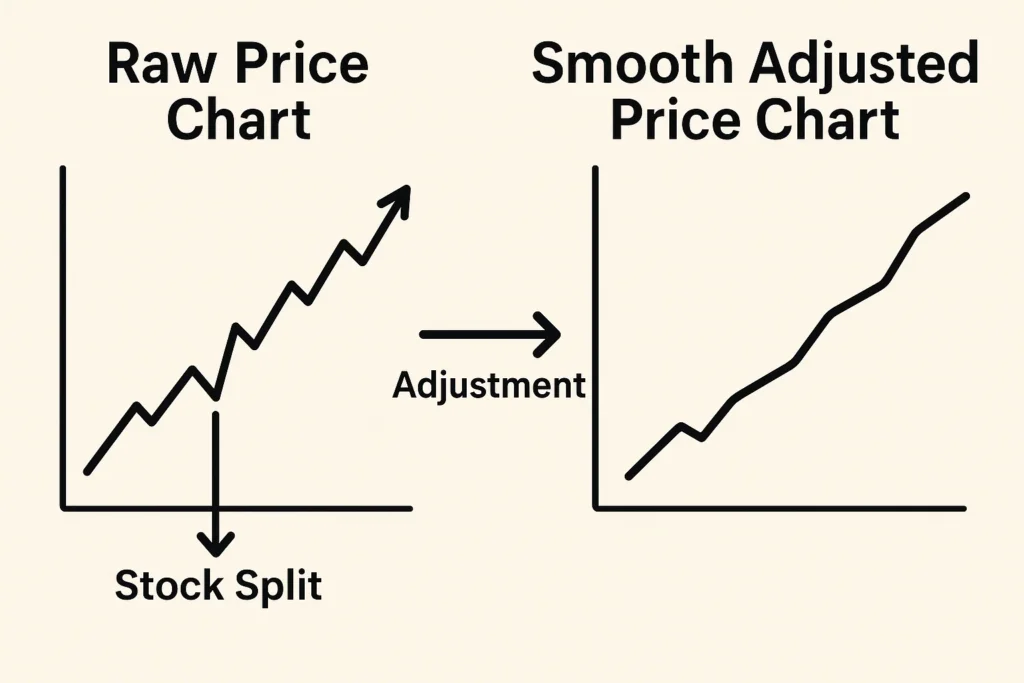
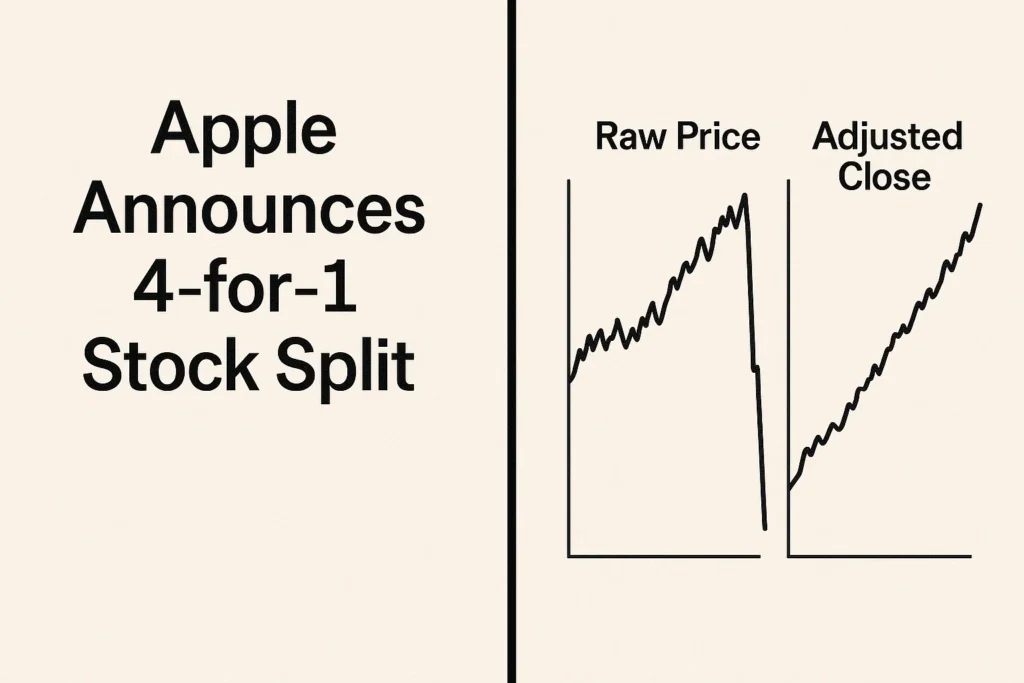
A classic example that highlights the critical difference between the raw closing price and the adjusted closing price is a stock split.
Case Study: Apple Inc. (AAPL) 2020 Stock Split
In August 2020, Apple announced a 4-for-1 stock split. Before the split, AAPL was trading at around $500 per share. After the market closed on August 28, 2020, the stock split became effective.
- Raw Closing Price (Pre-Split): ~$499.23 (August 28, 2020)
- Theoretical Opening Price (Post-Split): ~$124.81 ($499.23 / 4)
If you looked at a raw price chart, you would see a massive, artificial drop from $499 to $124. This would completely distort any historical return calculation. However, data providers automatically adjust all historical closing prices.
- Adjusted Closing Price (Pre-Split): All of Apple’s historical closing prices before August 31, 2020, are divided by 4. So, the $499 close is adjusted to ~$124.81 in your charting software.
This adjustment ensures that the chart reflects the true, continuous performance of the investment, accounting for the corporate action. An investor who bought one share at $100 (pre-split adjustment) can accurately see that their holding has increased in value without the chart being broken by the split.
This is a crucial concept for any investor analyzing US-listed giants like Apple or Tesla, which have had multiple splits. Always ensure your data source uses adjusted closing prices for long-term analysis. Reputable free sources like Yahoo Finance do this automatically.
Closing Price vs Opening Price
| Feature | Closing Price | Opening Price |
|---|---|---|
| What it represents | The final consensus value at the end of the trading day. | The initial consensus value at the start of the trading day. |
| Primary Use | Assessing end-of-day sentiment, calculating daily returns, charting. | Assessing overnight sentiment and initial reaction to news. |
| Determined By | Closing auction or last trade of the session. | Opening auction or first trade of the session. |
| Volatility Context | Can hide intraday volatility. | Can be gapped from the previous close, indicating sharp sentiment shifts. |
Conclusion
Understanding the closing price provides the foundational lens through which all market activity is measured and analyzed. While it is a powerful and essential benchmark, as we’ve seen, it should not be used in isolation. By incorporating the closing price alongside volume analysis, the day’s range, and other indicators—and always defaulting to the adjusted close for long-term studies—you can make more informed, data-driven decisions. Start by examining the closing prices on your own charts; notice how they form support and resistance and how they define the trend.
Ready to put these concepts into action? The right tools are essential. We’ve meticulously reviewed and ranked the best online brokers for technical analysis and long-term investing to help you get started.
Related Terms
- Opening Price: The first price at which a security trades when the market opens.
- Adjusted Closing Price: The closing price amended to include any corporate actions (dividends, splits) that occurred after the market close. This is vital for accurate historical analysis.
- Volume-Weighted Average Price (VWAP): The average price a security has traded at throughout the day, based on both volume and price. It is a popular benchmark for institutional traders.
- Candlestick Charts: A charting method that visually displays the Open, High, Low, and Close (OHLC) for a security, making the relationship between these prices easy to see.
Frequently Asked Questions
Recommended Resources
- The NASDAQ Glossary Entry on Closing Price provides a direct definition from a major exchange.
- Investopedia’s Explanation of Adjusted Closing Price offers a deeper dive into this critical concept.
- Yahoo Finance is a excellent free resource to view historical price data, including adjusted closing prices, for most securities.
