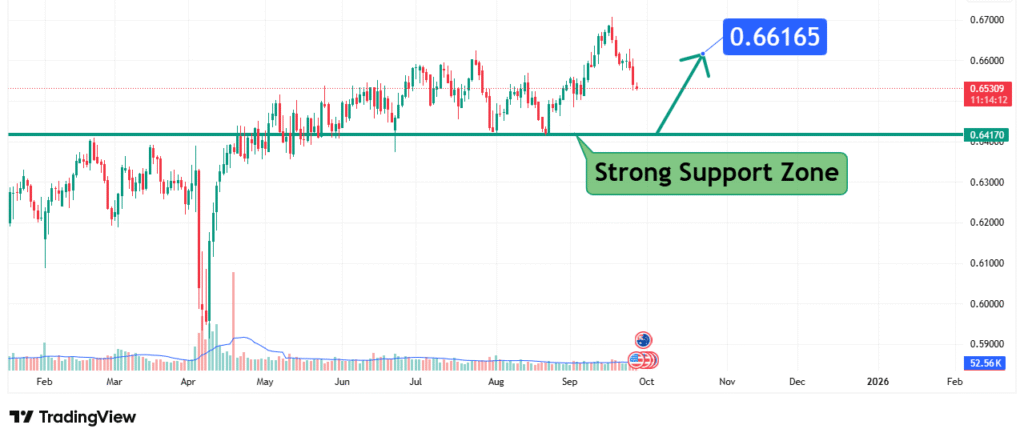
AUDUSD Price Analysis Bullish Reversal Pattern Targets 0.6600
The AUD/USD pair has experienced a significant downtrend but is now showing compelling evidence of a potential trend reversal. The price has established a Strong Support Zone near the 0.6400 level, forming what appears to be a double bottom pattern—a classic bullish reversal formation. Our analysis projects a move towards a primary target of 0.6600. This prediction is based on a confluence of technical factors, including the defense of a long-term support level and the completion of a key chart pattern.
Current Market Structure and Price Action
The long-term market structure for AUD/USD has been bearish, characterized by a series of lower highs and lower lows. However, the recent price action suggests this momentum is exhausting. The pair has found a firm base around the 0.6400 level, testing it twice in recent months and holding firm on both occasions. The formation of a double bottom pattern at this key support is a strong technical signal that sellers are losing control and buyers are stepping in, potentially initiating a new bullish phase.
Identification of the Key Support Zone
The most critical technical element on the chart is the Strong Support Zone between approximately 0.6400 and 0.6410.
- Historical Significance: This level has acted as a major multi-month low. The inability of sellers to push the price significantly below this zone on multiple tests confirms its strength and importance.
- Technical Confluence: The zone represents a key psychological level and has served as a launching pad for a substantial rally in the past, creating a strong base of market memory.
- Market Psychology: This area represents a point of value where long-term buyers find the Australian Dollar attractive, leading to aggressive accumulation and a shift in sentiment.
This multi-touch support confluence makes it a high-probability level for a significant bullish reaction.
Technical Target and Rationale
Our analysis identifies a clear primary price target.
- Primary Target (PT1): 0.6600
Rationale: This target is derived from the neckline of the double bottom pattern and the subsequent measured move. A confirmed break above the interim resistance (the neckline) would project a move equal to the height of the pattern, which aligns perfectly with the 0.6600 resistance zone. This level also coincides with a previous consolidation area, adding to its technical significance. Achieving this target from the current price would represent a gain of approximately 190 pips.

Prediction: We forecast that AUD/USD will confirm the double bottom pattern by breaking above its neckline and initiate a bullish wave towards our primary target at 0.6600.
Risk Management Considerations
A professional strategy is defined by its risk management.
- Invalidation Level (Stop-Loss): The entire bullish reversal thesis is invalidated if the price breaks down and achieves a sustained daily close below the support zone, specifically below 0.6360. This level would represent a breakdown of the double bottom pattern and a resumption of the broader bearish trend.
- Position Sizing: Any positions taken should be sized so that a loss triggered at the 0.6360 invalidation level represents a small, pre-defined percentage of your total capital (e.g., 1-2%).
Fundamental Backdrop
The technical setup is framed by the current fundamental landscape between the Australian Dollar and the US Dollar:
- Reserve Bank of Australia (RBA) vs. Federal Reserve (Fed): The monetary policy divergence is key. Any hawkish shift from the RBA or a more dovish tone from the Fed would be a strong tailwind for AUD/USD.
- Commodity Prices: As a commodity currency, the AUD is sensitive to the prices of key Australian exports like iron ore and coal. A rally in these commodities would support the Aussie Dollar.
- Risk Sentiment: The AUD is considered a risk-sensitive currency. A positive “risk-on” environment in global markets tends to benefit AUD/USD, while “risk-off” sentiment benefits the safe-haven USD.
Conclusion
AUD/USD is at a critical technical juncture, with a potential double bottom reversal pattern forming at a major support zone. The weight of evidence suggests a bullish resolution is likely, targeting a move to 0.6600. Traders should monitor for a confirmed break above the pattern’s neckline with increasing volume. Risk must be managed diligently by respecting the key invalidation level at 0.6360. A successful breach of the 0.6600 target will be crucial for confirming a larger trend reversal.
Chart Source: TradingView
Disclaimer: This analysis is for informational and educational purposes only and does not constitute financial advice or a recommendation to buy or sell any security. All trading and investing involves significant risk, including the possible loss of your entire investment. Always conduct your own research (DYOR) and consider seeking advice from an independent financial professional before making any trading decisions.


