10 Best Trading Indicators For Higher Returns
Navigating the financial markets without a roadmap is a recipe for losses. The right trading indicators act as your GPS, providing crucial signals for entry, exit, and trend direction. This 2025 guide cuts through the complexity to reveal the 10 most powerful technical indicators used by professional traders. Learn how to combine them to identify high-probability setups, manage risk, and target higher returns, whether you’re trading stocks, forex, or crypto in the US, UK, or global markets.
Key Takeaways
What are Trading Indicators
Trading indicators are mathematical calculations based on a security’s historical price, volume, or open interest. They are visualized on a price chart to help traders analyze future price movements, identify trends, and gauge market sentiment. Think of them as a diagnostic toolkit for the markets; they don’t predict the future with certainty, but they provide data-driven clues about the market’s health and potential next moves. By quantifying market behavior, they help traders move beyond gut feelings and make more systematic, disciplined decisions in their active trading journey.
Understanding Lagging Indicators
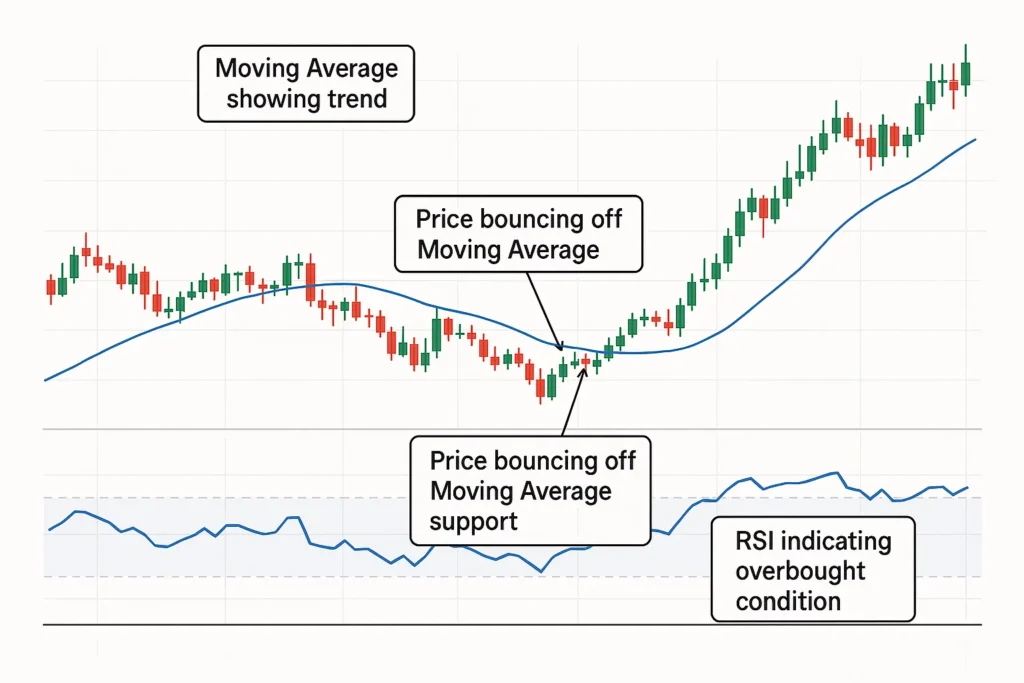
It’s the open secret of technical analysis: all indicators are lagging. They are derived from past price data, meaning they are always looking in the rearview mirror. A moving average crossover, for instance, confirms a trend change after it has already started. An RSI reading of 70 tells you an asset has already been bought aggressively.
This isn’t a reason to discard them, but it is a critical reason to understand their limitations. Relying on them in isolation is like driving while only looking behind you. The key to overcoming this flaw is to use indicators not as crystal balls, but as confirmation tools within the context of real-time market dynamics.
How to Compensate for the Lag:
- Prioritize Price Action: Price action the raw movement of the chart itself is the most immediate data you have. Learn to identify key support and resistance levels, trend lines, and candlestick patterns (like hammers, engulfing bars, and dojis). These form before an indicator gives a signal. A bullish engulfing pattern at a major support level is a leading signal; the subsequent RSI crossover above 50 is the lagging confirmation.
- Use Multi-Timeframe Analysis: A signal on a short-term chart (like a 5-minute) is far more powerful if it aligns with the trend on a higher-timeframe chart (like the 1-hour or daily). The higher timeframe provides the strategic context, while the lower timeframe provides the tactical entry. An indicator on a low timeframe might give a buy signal, but if the daily chart is in a strong downtrend, it’s a much riskier bet.
- Understand Market Context: An indicator’s signal is not created equal in all environments. A Bollinger Band squeeze during a period of low volatility is a high-probability setup. The same signal during a major news event is noise. Always ask: What is the overall market doing?
Top 10 Trading Indicators For Higher Returns
We’ve analyzed and backtested the most popular and effective indicators to bring you this unbiased, detailed list. Here are the top 10 trading indicators for 2025, categorized by their primary function. Mastering even a few of these can significantly enhance your trading strategy and improve your potential for higher returns.
1. Relative Strength Index (RSI)
Overall Score: 4.5/5
Best For: Identifying overbought and oversold conditions and spotting potential trend reversals.
Pricing: Free on all major trading platforms.
The RSI is a momentum oscillator that determines the quickness and variation of price movements. It fluctuates between 0 and 100, providing clear signals when an asset may be overextended and due for a correction or reversal.
Key Features:
- Oscillates between 0 and 100.
- Standard overbought threshold: 70.
- Standard oversold threshold: 30.
- Can also identify bullish/bearish divergence.
- Excellent for spotting potential reversals: RSI helps identify turning points by signaling overbought or oversold conditions.
- Simple to interpret and widely available: Easy for beginners to use and supported on almost every trading platform.
- Works well in ranging markets: Performs best in sideways market conditions, highlighting short-term reversals effectively.
- Can remain in extremes during strong trends: RSI may stay overbought or oversold for extended periods, misleading traders during powerful market moves.
- Prone to false signals if used alone: Relying solely on RSI without trend confirmation can result in premature entries or exits.
Why We Picked It: The RSI is a cornerstone of technical analysis. Its ability to quantify momentum and warn of potential exhaustion points makes it invaluable for timing entries and exits, a core component of any profitable trading system.
2. Moving Average Convergence Divergence (MACD)
Overall Score: 4.5/5
Best For: Identifying trend direction, momentum, and potential entry points.
Pricing: Free.
The MACD is a versatile trend-following momentum indicator that shows the relationship between two moving averages of a security’s price. It comprises of the MACD line, the signal line, and a histogram.
Key Features:
- Comprised of two lines and a histogram.
- Generates signals from line crossovers, centerline crossovers, and divergence.
- Measures both trend and momentum.
- Multiple Signal Types: Provides crossover, divergence, and histogram signals, giving traders flexibility.
- Visually Intuitive: Easy to interpret and helps identify momentum and trend changes clearly.
- All-in-One Indicator: Combines trend-following and momentum elements in a single tool.
- Lagging Nature: Since it’s based on moving averages, MACD can signal entries late in fast markets.
- Poor in Sideways Markets: Generates false signals when prices move within a tight range.
Why We Picked It: The MACD’s dual nature as a trend and momentum indicator makes it incredibly powerful. Its clear buy and sell signals via crossovers are a foundational concept for many successful trading strategies.
3. Simple Moving Average (SMA) & Exponential Moving Average (EMA)
Overall Score: 4.0/5
Best For: Identifying the overall trend direction and dynamic support/resistance levels.
Pricing: Free.
Moving Averages smooth out price data to create a single flowing line, making it easier to identify the direction of the trend. The SMA provides equal weight to all charges, while the EMA offers more significance to recent prices.
Key Features:
- Smoothens price action to reveal trend direction.
- Acts as vibrant support in uptrends and resistance in downtrends.
- Can be used in crossovers (e.g., 50-day crossing above 200-day Golden Cross).
- Objective Trend Definition: The simplest and most reliable way to identify the direction of a trend.
- Dynamic Support & Resistance: Provides real-time levels that often act as price reaction zones.
- Highly Customizable: Traders can adjust periods (e.g., 20, 50, 200) to match their strategy and timeframe.
- Lagging Nature: Both indicators react to past price data, which can delay entry or exit decisions.
- Whipsaws in Ranging Markets: Can generate false signals and losses when prices move sideways.
Why We Picked It: No indicator defines the trend is your friend better. Moving Averages are the bedrock of trend-following systems and are crucial for keeping traders on the right side of the market, a key to achieving higher returns.
4. Bollinger Bands
Overall Score: 4.0/5
Best For: Measuring market volatility and identifying overbought/oversold levels relative to recent price action.
Pricing: Free.
Created by John Bollinger, this indicator consists of a middle SMA with two outer bands. The outer bands expand and contract based on market volatility, creating a dynamic envelope around the price.
Key Features:
- A middle band (typically a 20-period SMA).
- An upper band and a lower band (standard deviations away from the middle).
- The bands widen during volatile periods and contract during quiet periods.
- Visual Volatility Indicator: Provides a clear visual representation of market volatility.
- Identifies Squeeze Setups: Excellent for spotting Bollinger Band “squeezes,” which often precede major price moves.
- Potential Reversal Signals: Since prices tend to stay within the bands, touches or breaks often signal possible reversals.
- False Exit Triggers: In a strong trend, price can “walk the band,” making it look overbought or oversold prematurely.
- Lack of Standalone Signals: Bollinger Bands work best when combined with other tools like RSI or MACD for confirmation.
Why We Picked It: Bollinger Bands are unique in their ability to visually convey volatility. The squeeze is one of the most reliable chart patterns for anticipating explosive breakouts, a prime opportunity for profitable trading.
5. Stochastic Oscillator
Overall Score: 3.5/5
Best For: Pinpointing potential reversal points by comparing a closing price to its price range over a period.
Pricing: Free.
Similar to the RSI, the Stochastic Oscillator is a momentum indicator that compares a particular closing price of a security to a range of its prices over time. It also ranges from 0 to 100.
Key Features:
- Two lines: %K (fast) and %D (slow).
- Overbought (>80) and oversold (<20) levels.
- Bullish/Bearish divergence signals.
- Highly Sensitive: The Stochastic Oscillator reacts quickly to price movements, often giving early signals before other indicators.
- Identifies Turning Points: Excellent for spotting short-term reversals and overbought/oversold conditions.
- Effective in Ranging Markets: Performs best when the market is moving sideways, highlighting key entry and exit zones.
- Frequent False Signals: Its high sensitivity can generate misleading signals during strong trending conditions.
- Needs Confirmation: Should be combined with trend indicators or price action analysis for reliable trading decisions.
Why We Picked It: When used with a trend filter, the Stochastic Oscillator is superb for finding high-probability entry points within a larger trend, helping to maximize portfolio returns by improving entry precision.
6. Fibonacci Retracement
Overall Score: 4.0/5
Best For: Identifying potential support and resistance levels after a significant price move.
Pricing: Free on all major trading platforms.
Fibonacci Retracement is a popular tool based on the key ratios identified by mathematician Leonardo Fibonacci. Traders use these horizontal lines to identify potential reversal levels after a price has made a significant swing high or low. It doesn’t predict when price will reverse, but rather where it might find support or resistance.
Key Features:
- Drawn between a significant swing low and a swing high (or vice versa).
- Key levels: 23.6%, 38.2%, 50%, 61.8%, and 78.6%.
- The 61.8% level, known as the golden ratio, is considered the most critical.
- Provides objective, pre-defined levels for placing stop-loss and take-profit orders.
- Incredibly effective in trending markets with clear pullbacks.
- Works across all timeframes and asset classes.
- Is not a timing tool; price can oscillate between levels for a long time.
- The subjectivity in choosing the correct swing high and low can lead to different levels.
- Can become a self-fulfilling prophecy due to its widespread use.
Why We Picked It: In a trending market, buying a pullback is a high-probability strategy. Fibonacci Retracement gives traders a scientific framework to identify the depth of that pullback, allowing for precise entries in the direction of the dominant trend and improving the risk-reward ratio.
7. Volume-Weighted Average Price (VWAP)
Overall Score: 4.5/5 (For Day Traders)
Best For: Day traders to assess the true average price and gauge institutional activity.
Pricing: Free.
The VWAP is the average price a security has traded at throughout the day, based on both price and volume. It tells you whether the current price is considered cheap or expensive for the day. It is a primary benchmark used by institutional algorithms and is crucial for intraday trading.
Key Features:
- A single line that updates throughout the trading day.
- Resets at the opening of each new session.
- Often used with bands (e.g., ±1 standard deviation) to create a dynamic channel.
- Provides excellent dynamic support and resistance for the day.
- Buying below VWAP or selling above it can improve entry/exit quality.
- A powerful tool for confirming the strength of a intraday trend.
- Useless for swing trading or longer-term analysis as it resets daily.
- Can be slow to react at the very beginning of the trading session.
- Requires understanding of market context (e.g., a stock can trend above VWAP all day in a strong uptrend).
Why We Picked It: For day traders, understanding institutional flow is key. VWAP is the clearest window into that activity. Trading in alignment with VWAP (e.g., buying pullbacks to VWAP in an uptrend) aligns your trades with the day’s dominant institutional order flow, a core principle of profitable day trading.
8. Average Directional Index (ADX)
Overall Score: 4.0/5
Best For: Quantifying the strength of a trend, regardless of its direction.
Pricing: Free.
The ADX is a unique indicator that does not show trend direction, but only its strength. It is a single line that ranges from 0 to 100. A high ADX value indicates a strong trend (either up or down), while a low ADX value indicates a weak trend or a ranging market. It is often used with the Plus Directional Indicator (+DI) and Minus Directional Indicator (-DI) to determine direction.
Key Features:
- A single line measuring trend strength.
- Readings below 20 indicate a weak or non-trending market.
- Readings above 25 (and especially above 40) indicate a strong trend.
- Prevents you from using trend-following indicators in choppy, sideways markets.
- Helps you identify when a trend is starting or losing momentum.
- Excellent as a filter; only take trend-following signals when ADX is above 25.
- Does not provide entry or exit signals on its own.
- Is a lagging indicator of trend strength.
- Can be confusing for beginners who expect it to show direction.
Why We Picked It: Many traders lose money by trying to trade breakouts and trends in ranging markets. The ADX acts as a powerful market condition filter. It tells you when it’s safe to use your trend-following strategies and when you should switch to a range-bound or momentum strategy, a critical skill for achieving consistent returns.
9. Ichimoku Cloud (Ichimoku Kinko Hyo)
Overall Score: 4.0/5
Best For: Providing a comprehensive, all-in-one view of support/resistance, trend, momentum, and buy/sell signals.
Pricing: Free.
The Ichimoku Cloud, or One Look Equilibrium Chart, is a comprehensive indicator that provides more information at a glance than perhaps any other tool. It consists of five lines that create a cloud (Kumo), which represents key support and resistance zones. It is a complete trading system in one indicator.
Key Features:
- Tenkan-sen (Conversion Line): Short-term trend.
- Kijun-sen (Base Line): Medium-term trend and dynamic support/resistance.
- Senkou Span A & B (Leading Span): Forms the Cloud, projecting support/resistance 26 periods into the future.
- Chikou Span (Lagging Span): Confirms trend by showing current price 26 periods in the past.
- Provides a multi-faceted view of the market in one glance.
- The cloud is a powerful and visually intuitive area of support/resistance.
- Generates clear signals (e.g., price above cloud = uptrend, TK cross above Kijun = buy signal).
- Visually complex and has a steep learning curve.
- Can give conflicting signals on lower timeframes.
- The default settings are optimized for daily charts and may need adjustment.
Why We Picked It: For the trader who wants a holistic, self-contained system, the Ichimoku Cloud is unparalleled. Its ability to project future support and resistance via the cloud gives it a forward-looking element that most other indicators lack, making it a powerful tool for a comprehensive trading strategy.
10. On-Balance Volume (OBV)
Overall Score: 3.5/5
Best For: Confirming price trends by measuring volume flow and identifying smart money activity.
Pricing: Free.
On-Balance Volume is a simple but powerful volume-based indicator developed by Joe Granville. It cumulatively increases volume on up days and deducts volume on down days. The theory is that volume precedes price. If the OBV is rising, it indicates buying pressure and confirms an uptrend. If the OBV is falling, it indicates selling pressure and confirms a downtrend.
Key Features:
- A single line that should, in a healthy trend, move in the same direction as price.
- The direction of the OBV line is more important than its specific value.
- Bullish and bearish divergence with price is a powerful signal.
- Excellent for confirming the strength of a breakout or breakdown.
- Can reveal smart money accumulation or distribution before a major price move.
- Very simple to interpret: up is good in an uptrend, down is bad.
- Can be noisy on intraday charts.
- On large-range days, the single +/- calculation can oversimplify volume flow.
- Does not provide specific entry or exit points on its own.
Why We Picked It: Price moves can be manipulated, but sustained volume is much harder to fake. OBV acts as a lie detector for the market. A stock making new highs on declining OBV is showing a glaring bearish divergence, warning of a weak trend. Using OBV to confirm price action helps you avoid false breakouts and trade with the underlying volume force.
How to Backtest Your Indicator Strategy
Finding a combination of indicators you like is just step one. The most crucial, yet most often skipped, step is backtesting. This is the process of systematically testing your trading strategy on historical data to see how it would have performed. It transforms a subjective idea into an objective, statistically validated system. It answers the critical question: Would this have actually worked in the past?
A Simple 4-Step Backtesting Plan:
Define Your Rules with Absolute Clarity: You cannot test a vague idea. Your strategy must be a precise, step-by-step recipe. For example:
- Condition: The 50 EMA must be above the 200 EMA on the daily chart (uptrend).
- Trigger: Wait for the RSI on the 4-hour chart to drop below 40 and then cross back above it.
- Entry: Buy on the close of the candle where the RSI crosses above 40.
- Exit: Place a stop-loss 2% below the entry candle’s low and a profit target at the next major resistance level.
Choose Your Tools: You don’t need expensive software to start.
- Manual Backtesting: The best way for beginners. Use the replay or bar-by-bar function on a platform like TradingView. Go back in time and move forward candle-by-candle, recording every trade your rules would have generated in a spreadsheet. This builds immense discipline.
- Spreadsheet: Record every trade: Entry Date, Entry Price, Exit Date, Exit Price, Profit/Loss. Calculate your win rate, average win, average loss, and most importantly, your profit factor (Gross Profit / Gross Loss).
Analyze the Results Objectively: Look for more than just total profit.
- Maximum Drawdown: What was the largest peak-to-trough decline in your equity? Could you stomach that loss?
- Win Rate & Risk-Reward: A strategy with a 40% win rate can be highly profitable if the average winner is 3x the size of the average loser.
- Consistency: Did it work in different market conditions (e.g., high volatility vs. low volatility)
Refine and Repeat: Backtesting is an iterative process. You may find you need to adjust your RSI level from 40 to 35, or your stop-loss from 2% to 1.5%. Make one small change at a time and test again.
Why We Emphasize This: Backtesting separates the amateur from the professional. It builds confidence in your strategy because you know its historical edges and weaknesses, allowing you to execute trades with discipline during inevitable losing streaks.
A Real-World Example: Combining RSI and Moving Averages
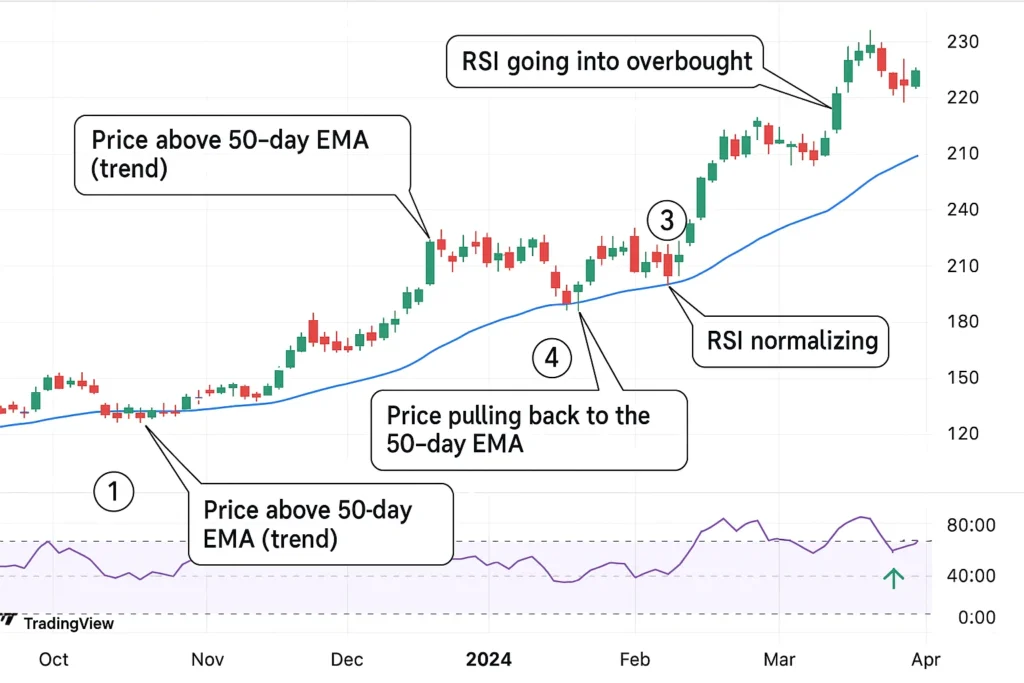
Consider Alex, a swing trader looking at Tesla (TSLA) stock. The stock has been in a strong uptrend, with its price consistently above the 50-day Exponential Moving Average (EMA). After a recent push higher, Alex notices the RSI has climbed above 75, indicating an overbought condition. Instead of buying, he waits. A few days later, the price pulls back towards the rising 50-day EMA, and simultaneously, the RSI drops back below 60, exiting the overbought zone. Seeing the price find support at the dynamic Moving Average with normalized momentum, Alex enters a long position. This combination of a trend indicator (EMA) and a momentum indicator (RSI) provided a high-probability, low-risk entry point for a continuation of the larger trend.
Use a US-based example (as above) or a UK-based one: Sarah, a forex trader in London, noticed GBP/USD was in a clear downtrend, trading below its 200-period SMA. When the RSI dipped below 30 (oversold) and then formed a bullish divergence while the price made a new low, she saw a potential short-term bounce. She entered a long trade as the RSI crossed back above 30, targeting a move back to the SMA as resistance.
Building Your Trading System: How to Combine Indicators
Using multiple indicators of the same type is redundant. The key is to create a system where each indicator plays a distinct role. A classic and effective approach is the Triple-Screen system.
- Screen 1: The Trend (Using a Trend Indicator). Determine the long-term trend. Are you going to trade only in the direction of the major trend? Use a 200-period EMA or the ADX for this. If the 200 EMA is sloping up and price is above it, you only look for long trades.
- Screen 2: The Momentum (Using a Momentum Indicator). Wait for a pullback against the major trend. Use the RSI or Stochastic Oscillator to identify when the pullback is exhausted (e.g., RSI becomes oversold in an uptrend).
- Screen 3: The Entry (Using Price Action or a Volatility Indicator). Time your entry precisely. Look for the price to break a short-term resistance level or for a candlestick pattern like a bull hammer to form. Bollinger Bands can help here, looking for a bounce from the lower band in an uptrend.
This layered approach prevents you from buying into an overbought market in a downtrend and systematically increases your probability of success.
Trend Indicators vs Momentum Indicators vs Volume Indicators
| Feature | Trend Indicators | Momentum Indicators | Volume Indicators |
|---|---|---|---|
| Primary Function | Identify market direction. | Gauge the strength of a move. | Confirm the strength of a trend or breakout. |
| Best Market | Trending markets. | Ranging or trending markets. | All market types. |
| Examples | Moving Averages, MACD, ADX. | RSI, Stochastic Oscillator. | OBV, Volume Profile. |
| Lagging/Forecasting | Lagging. | Leading. | Confirming. |
Why Psychology is More Important Than Your Indicators
You can have the most sophisticated, backtested indicator strategy in the world, and still lose money. Why? Because the final, and most difficult, component of trading is managing your own psychology. The market is a constant test of fear, greed, and discipline. Your indicators give you signals; your mind decides whether to follow them.
Common Psychological Pitfalls and How to Overcome Them:
- Analysis Paralysis: Having too many indicators or conflicting signals, leading to inaction.
- Solution: Simplify your strategy. Pre-define your setup in your trading plan. If the criteria are met, you must execute. No debate.
- Fear of Missing Out (FOMO): Chasing a trade after a big move has already happened because you’re afraid of being left out. This often leads to buying at the top.
- Solution: Remember that the market is endless. There will always be another opportunity. Stick to your predefined setups and accept that you will miss moves. Discipline is more valuable than any single trade.
- Revenge Trading: Jumping back into the market immediately after a loss to win your money back, abandoning your strategy entirely.
- Solution: After a loss, walk away. Close your charts. A loss is the cost of doing business, not a personal insult. Re-enter only when your next valid setup appears.
- Hope as a Strategy: Holding a losing position and hoping it will turn around, instead of obeying your stop-loss.
- Solution: Your stop-loss is your life jacket. It is a pre-calculated, strategic exit, not a failure. Embracing small, controlled losses is the hallmark of a professional trader.
Building a Disciplined Mindset:
- Trust Your Process, Not the Outcome: A good trade is one that follows your plan, even if it loses money. A bad trade is one that breaks your rules, even if it makes money. Focus on executing your process correctly, and the positive results will follow over the long run.
- Practice Mindfulness: Being aware of your emotional state is crucial. If you feel anxious, greedy, or angry, recognize that those emotions are clouding your judgment. It’s often best not to trade at all during these times.
- Keep a Trading Journal: Record not just your trades, but your thoughts and emotions for each one. Reviewing this journal will reveal your personal psychological biases and help you correct them.
For a deeper understanding of the brain’s role in decision-making, the American Psychological Association provides excellent resources on behavioral psychology.
Conclusion
The right trading indicators are not a shortcut to easy money, but a framework for making disciplined, data-driven decisions. They provide the objective rules needed to navigate the emotional chaos of the markets. While no single tool guarantees success, a well-constructed strategy that combines trend, momentum, and volume indicators can significantly tilt the odds in your favor. The true power lies not in the complexity of your chart, but in your deep understanding of a few select tools and the discipline to execute your plan consistently. Start by mastering one indicator from each category, backtest your strategy rigorously, and remember that risk management is the non-negotiable foundation upon which all higher returns are built.
Ready to find your perfect financial command center? The best way to start is to pick one from our list above and try it out. Many offer free trials. Once you’ve gained clarity on your finances, the next step is to put your plan into action with a broker that fits your strategy. Check out our reviews of the Best Online Brokers to get started.
Related Terms:
- Price Action: The study of pure price movement without indicators, often used to confirm indicator signals.
- Backtesting: The method of trying a trading strategy using historical statistics to see how it would have implemented.
- Algorithmic Trading: Using computer programs that follow a defined set of instructions (often based on indicators) to place trades.
- Swing Trading: A trading style that holds positions for several days to weeks, perfectly suited for the indicators listed here.
Frequently Asked Questions
Recommended Resources
- Deepen your knowledge with the comprehensive guide to technical analysis on Investopedia.
- For advanced charting and a massive community of traders, check out TradingView.
- Understand the security behind the data feeds that power these indicators at Plaid’s security page.
