
Bitcoin (BTC) Price Analysis Bullish Breakout Imminent, Targeting $126,300
Bitcoin’s price has been consolidating and finding strong support around the $115,000 area. This price action, following a significant rally, suggests a healthy bullish bias is forming as it gathers energy for the next leg up. Our analysis projects a move towards a primary target of $126,300, with a key intermediate target at $120,630. This prediction is based on a confluence of technical factors, including the defense of a strong support zone and the underlying bullish market structure.
Current Market Structure and Price Action
The broader market structure for Bitcoin remains decisively bullish, characterized by a series of higher highs and higher lows. The price is currently interacting with a crucial support zone, which has held firm on recent tests. Recent price action has shown low volatility compression near this support, indicating that a bullish breakout may be imminent as selling pressure is absorbed.
Identification of the Key Support Zone
The most critical technical element on the chart is the Strong Support Zone between approximately $115,100 and $116,000. The strength of this zone is derived from:
- Historical Significance: This level has acted as both resistance and support in recent weeks, with a clear break above it in early December confirming its new role as a springboard for higher prices.
- Technical Confluence: The zone aligns with the 50-period Simple Moving Average (SMA) on the daily chart, a dynamic indicator often used by institutional and retail traders to define the medium-term trend.
- Market Psychology: This area represents a point where dip-buyers have consistently stepped in, demonstrating conviction and preventing a deeper retracement.
This multi-layered confluence makes it a high-probability level for a bullish reaction and the next leg higher.
Technical Target(s) and Rationale
Our analysis identifies the following price targets:
Primary Target (PT1): $126,300
This level represents the recent all-time high and a major psychological resistance. A break above the current consolidation would naturally target this previous peak.
Secondary Target (PT2): $120,630
This is a key intermediate target. It acts as a significant resistance level from the November-December consolidation phase and represents the first major hurdle for the bulls. A clean break above this level would confirm strength and open the path directly to PT1.
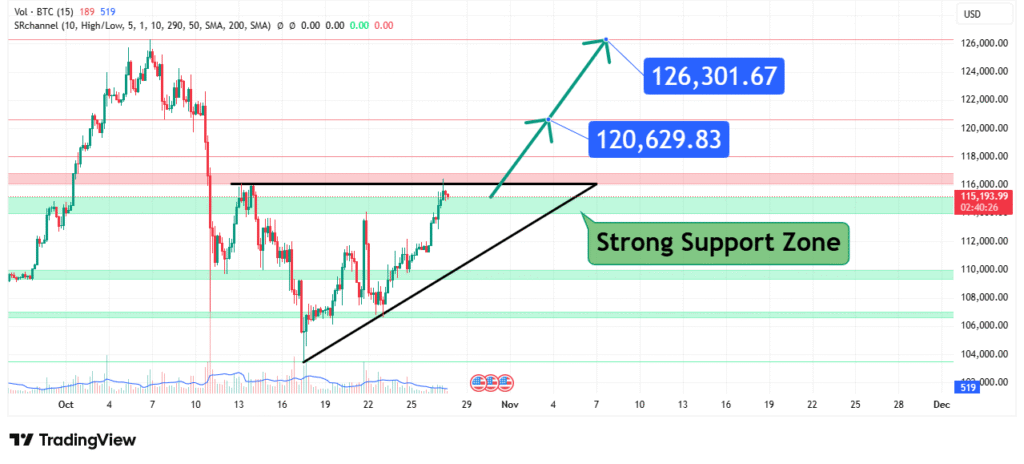
Prediction: We forecast that the price will hold the identified support zone and break above the immediate resistance, moving towards the intermediate target at $120,630. A sustained move beyond that would then open the clear path towards our primary target at $126,300.
5. Risk Management Considerations
A professional strategy is defined by its risk management.
- Invalidation Level (Stop-Loss): The entire bullish thesis is invalidated if the price achieves a daily close below the strong support zone, specifically below $112,000. This level represents a clear break of the market structure (a lower low) and would signal a failure of the bulls to defend their key ground.
- Position Sizing: Any long positions taken should be sized so that a loss triggered at the $112,000 invalidation level represents a small, pre-defined percentage of your total capital (e.g., 1-2%).
Fundamental Backdrop
The technical setup is framed by the current fundamental landscape:
- Factor 1: Continued inflows into spot Bitcoin ETFs are providing a new, structural source of buy-side demand.
- Factor 2: Macroeconomic expectations of a potential pivot in Federal Reserve interest rate policy in 2024 are creating a favorable environment for risk assets like Bitcoin.
- Factor 3: The upcoming Bitcoin halving in 2024 continues to be a dominant bullish narrative, reinforcing the long-term supply shock thesis.
These factors contribute to the overall bullish sentiment surrounding the asset, providing a tailwind for the technical setup.
Conclusion
Bitcoin is at a technical inflection point, coiling within a strong support zone. The weight of evidence from price action, key technical levels, and fundamental tailwinds suggests a bullish resolution, targeting a move first to $120,630 and ultimately to $126,300. Traders should monitor for a confirmed breakout above local resistance and manage risk diligently by respecting the key invalidation level at $112,000. The reaction at the $126,300 target zone will be crucial for determining the next major directional move.
Chart Source: TradingView
Disclaimer: This analysis is for informational and educational purposes only and does not constitute financial advice or a recommendation to buy or sell any security. All trading and investing involves significant risk, including the possible loss of your entire investment. Always conduct your own research (DYOR) and consider seeking advice from an independent financial professional before making any trading decisions.
