Bitcoin (BTCUSD) Price Analysis Bearish Reversal Targets $104,000
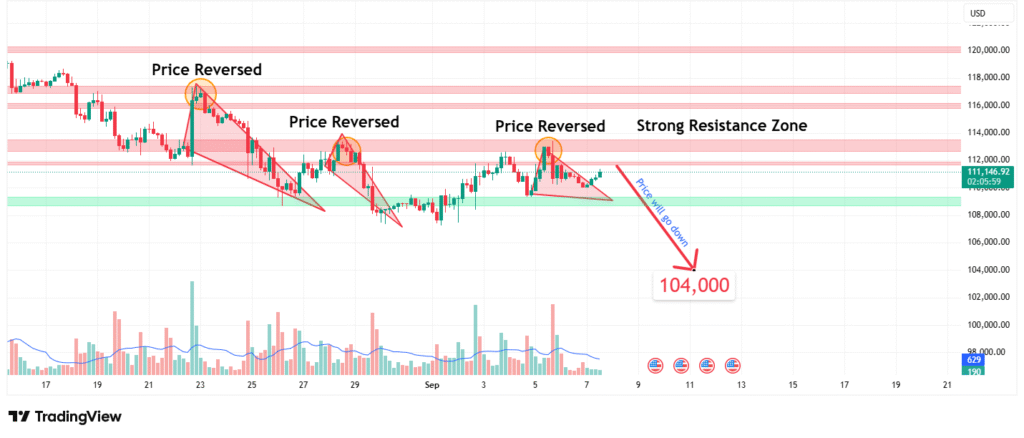
Bitcoin’s price has faced a strong rejection after rallying into a significant resistance zone. This price action suggests a bearish reversal is underway. Our analysis projects a decline towards a primary target of $104,000. This prediction is based on a confluence of technical factors, including multiple bearish reversal signals and a reaction from a historically strong resistance area.
Current Market Structure and Price Action
The recent market structure has shifted from bullish to neutral-bearish. The price has failed to make a significant higher high and has instead printed multiple “Price Reversed” signals on the daily chart, indicating strong selling pressure at current levels. The price is currently interacting with a Strong Resistance Zone, which has catalyzed these reversal candles. This cluster of bearish price action signals that a breakdown may be imminent.
Identification of the Key Resistance Zone
The most critical technical element is the Strong Resistance Zone that price is currently testing. The strength of this zone is derived from:
- Historical Significance: This level has acted as a major swing high and area of consolidation on previous occasions, creating a memory in the market where sellers have previously emerged.
- Technical Confluence: The zone aligns with a key psychological level, adding to its importance as a barrier for buyers.
- Market Psychology: This area represents a point where buyer exhaustion becomes evident and seller sentiment strengthens significantly, as confirmed by the repeated “Price Reversed” indications.
This multi-faceted confluence makes it a high-probability zone for a bearish reaction.
Technical Target and Rationale
Our analysis identifies the following price target:
- Primary Target (PT1): $104,000
Rationale: The $104,000 level is projected to act as a strong support zone. It represents a previous major swing high and a key psychological round number. A decline to this level would represent a typical and healthy retracement within a larger trend, offering a logical profit-taking target for bears and a potential accumulation zone for bulls.

Prediction: We forecast that the price will break down from the current resistance zone and move towards our PT1 at $104,000.
Risk Management Considerations
A professional strategy is defined by its risk management.
- Invalidation Level (Stop-Loss): The entire bearish thesis is invalidated if the price achieves a daily close above the current resistance zone (approximately above $114,000). This level represents a clear break of the market structure that led to the reversal signals, indicating buyers have overcome selling pressure and are likely to continue the rally.
- Position Sizing: Any short positions taken should be sized so that a loss triggered at the invalidation level represents a small, pre-defined percentage of your total capital (e.g., 1-2%).
Fundamental Backdrop (Context)
The technical setup is framed by the current fundamental landscape:
- Macroeconomic Uncertainty: Ongoing concerns about interest rates and global liquidity can create headwinds for risk-on assets like Bitcoin.
- Market Sentiment: Extreme greed or fear in the market can often coincide with local tops and bottoms, adding context to technical reversals.
- On-Chain Metrics: Monitoring exchange flows and the realized price can provide additional confirmation of whether large holders are distributing coins near resistance.
These factors contribute to the cautious and potentially bearish sentiment surrounding the asset in the short term.
Conclusion
Bitcoin is at a technical inflection point after being rejected from a strong resistance zone. The weight of evidence, including multiple bearish reversal signals, suggests a downward resolution, targeting a move to $104,000. Traders should monitor for a confirmed breakdown and manage risk diligently by respecting the key invalidation level above the resistance zone. The reaction at the $104,000 support target will be crucial for determining the next major directional move.
Chart Source: TradingView
Disclaimer: This analysis is for informational and educational purposes only and does not constitute financial advice or a recommendation to buy or sell any security. All trading and investing involves significant risk, including the possible loss of your entire investment. Always conduct your own research (DYOR) and consider seeking advice from an independent financial professional before making any trading decisions.


