Bitcoin's Bullish Breakout, May Hit $119,000 Target
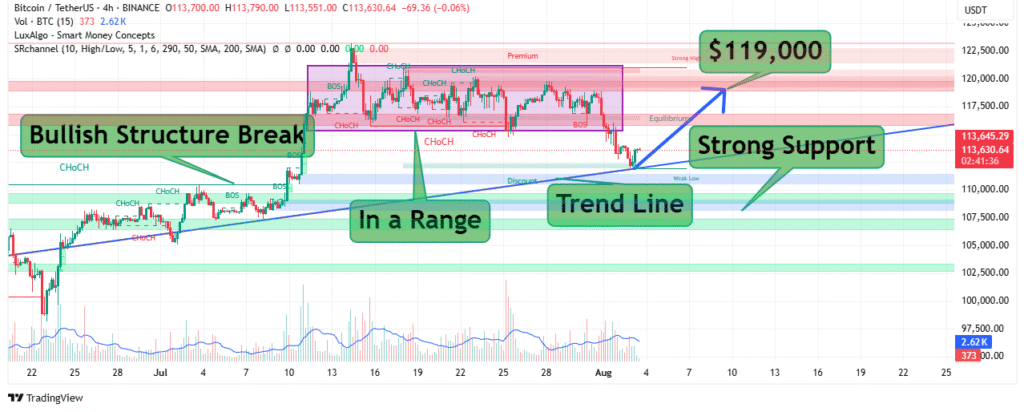
Bitcoin (BTC) continues to show strong bullish momentum on the 4-hour timeframe, with recent price action highlighting a critical trend line, structural breaks, and significant support and resistance levels. The current setup indicates a potential move toward the $119,000 target if buyers can maintain control above the established support zones.
Key Highlights from the Chart
- Bullish Structure Break: BTC has broken multiple key resistance levels in recent weeks, confirming a bullish structure shift. This break indicates strong buying pressure and sets the foundation for a potential continuation toward higher levels.
- Trend Line Support: A rising trend line has been consistently supporting Bitcoin’s price since late June, providing a clear bullish trajectory. As long as BTC trades above this line, the overall market sentiment remains positive.
- Range Formation: Price action entered a consolidation phase between mid-July and late July, forming a horizontal range (marked as “In a Range”). This period allowed the market to cool off before its next move, creating equilibrium zones between premium and discount pricing.
- Strong Support Zone: The $110,000–$112,000 region acts as a critical support level. This zone aligns with the trend line and previous breakout points, making it a key area for bulls to defend.
- Target at $119,000: The immediate resistance and potential bullish target is around $119,000. A clean breakout above this level could pave the way for further upside, possibly testing the psychological $120,000 mark and beyond.
Understanding the Structure: BOS and CHoCH
The chart highlights two essential price action concepts: Break of Structure (BOS) and Change of Character (CHoCH).

- BOS (Break of Structure): Indicates continuation of the bullish trend when price surpasses previous highs.
- CHoCH (Change of Character): Signals potential shifts in market behavior, often marking the transition between bullish and bearish phases or vice versa.
These concepts help traders identify trend confirmation and possible reversals.
Price Zones and Market Sentiment
1. Premium and Discount Zones
The chart is divided into premium (upper range) and discount (lower range) areas:
- Premium zone: Above equilibrium, often used by sellers to take profits.
- Discount zone: Below equilibrium, where buyers typically look for entries.
2. Equilibrium Level
Equilibrium acts as the midline of the range, serving as a pivot point. A sustained move above equilibrium suggests bullish continuation, while a move below signals weakness.
Potential Scenarios
Bullish Scenario
- Hold above trend line support near $112,000.
- Break and close above $119,000 resistance.
- Target next psychological levels: $120,000–$125,000.
Bearish Scenario
- Failure to hold $110,000–$112,000 support.
- Breakdown below trend line could retest $105,000 or lower support zones.
Trading Considerations
- Entry Zones: Look for long entries near the trend line or on a breakout above $119,000 with strong volume confirmation.
- Stop Loss: Place stops below the $110,000 support or trend line to manage risk.
- Take Profit: Initial target $119,000, with extended targets toward $125,000 if momentum continues.
Conclusion
Bitcoin’s price structure currently favors the bulls, supported by a well-defined trend line and strong demand zones. The key level to watch is $119,000, which represents immediate resistance and the next major upside target. A decisive breakout above this point could trigger a fresh rally toward new highs, while failure to hold above the trend line may invite short-term corrections.


