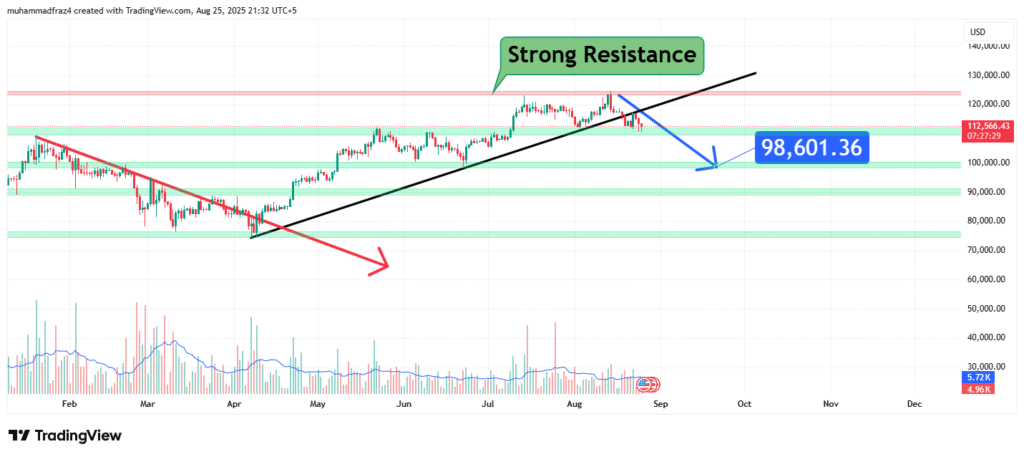
Bitcoin Confronts Formidable Resistance A Retracement to $98,601 Likely
Bitcoin’s impressive bullish run has encountered a significant and potentially formidable obstacle, clearly identified on the chart as “Strong Resistance.” This resistance zone represents a critical technical and psychological barrier where historical selling pressure has emerged, causing previous advances to falter. The current price action near this ceiling is crucial; it represents a battle between buyers aiming to propel the asset into price discovery and sellers looking to defend this upper boundary and trigger a profitable correction. The chart indicates that the rally has stalled at this juncture, exhibiting classic signs of hesitation and potential rejection. This analysis will argue that the resistance is likely to hold in the near term, leading to a necessary and healthy corrective pullback.
The Nature of Strong Resistance: A Confluence of Selling Pressure
The term “Strong Resistance” is used to describe a price zone, not merely a single level, where multiple technical factors align to create a potent supply barrier. The resistance area shown on the chart, with its upper boundary near $117,566.43, is powerful for several probable reasons. It may represent a major historical all-time high or a significant swing high from a previous cycle. Furthermore, it could coincide with key Fibonacci extension levels (e.g., the 1.272 or 1.414 Fib) derived from prior corrective waves. The convergence of these technical indicators creates a “wall” of sell orders from both profit-takers and those initiating short positions. The inability of the price to swiftly break through this zone on the first attempt, as shown by the recent price consolidation or wicks to the downside, is the first sign of buyer exhaustion and seller aggression.
Bearish Price Projection and the $98,601 Target
When a market fails to break through a strong resistance zone, the typical outcome is a retracement toward the nearest major support level. This pullback serves to shake out weak longs, reset overbought technical indicators, and build energy for the next potential assault on the resistance. The most logical initial target for such a decline is the $98,601.36 USD level. This price point is strategically significant as it likely represents:

- The Previous All-Time High (ATH): A former major resistance level that, once broken, often flips to become powerful support.
- A Key Psychological Level: A major round number that attracts institutional buy-side interest.
- The Neckline of a Bullish Pattern: It could be the breakout point of a large bullish pattern (e.g., a cup and handle), making it a logical retest target.
A retracement to this level would constitute a healthy ~16% correction from the recent highs, which is a common and expected pullback within a strong bull trend.
Risk Management: The Bullish Invalidation Scenario
For this bearish near-term pullback thesis to be valid, the price must remain capped by the identified strong resistance. The key level to watch for a bearish confirmation is a break below the most recent higher low, which would signal a shift in short-term momentum. However, it is essential to define the conditions that would invalidate this outlook entirely. The bearish pullback scenario is nullified if Bitcoin achieves a decisive, high-volume daily and weekly close above the strong resistance zone, particularly above $120,000. Such a move would signify a clear victory for the bulls, negating the rejection and likely triggering a rapid short squeeze and a powerful FOMO-driven rally into uncharted territory. Until that occurs, the prudent assumption is that resistance will hold and a retracement is imminent.
Conclusion: A Healthy Pause Before the Next Leg
In conclusion, Bitcoin’s encounter with strong resistance suggests the market is due for a pause or pullback. This is not a signal of a bull market ending but rather a natural and healthy process within a sustained uptrend. The projected decline to the $98,601 support level offers a potential opportunity for traders to secure profits on long positions and prepare to re-enter at more favorable prices. For investors, it represents a potential buying dip within the larger bullish cycle. The overall trend remains positive, but navigating these interim corrections is key to maximizing returns and managing risk effectively.
Chart Source: TradingView
Disclaimer: This analysis is based on technical patterns and is for informational purposes only. It is not financial advice. The cryptocurrency market is extremely volatile. Always conduct your own research and manage your risk accordingly.
How did this post make you feel?
Thanks for your reaction!


