Bitcoin Price Analysis Bullish Breakout Targets $120,330
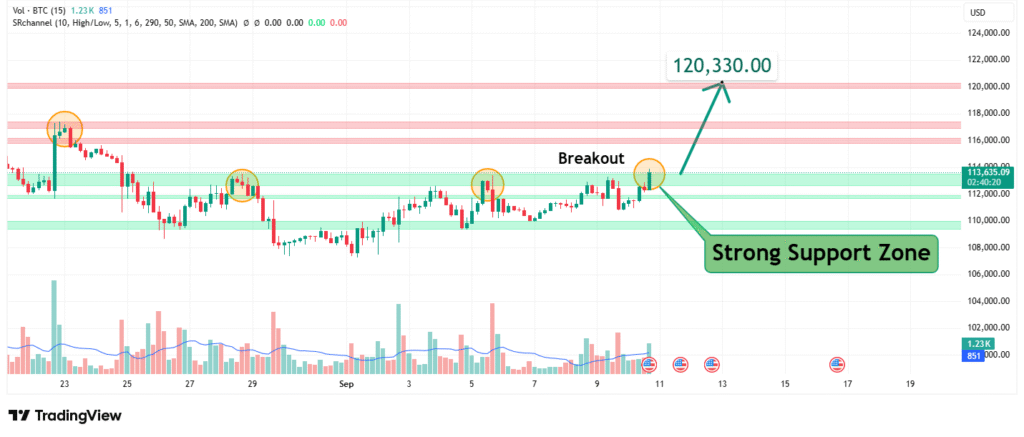
Bitcoin’s price has recently executed a breakout and is now consolidating above a strong support zone. This price action suggests a healthy bullish bias is forming, allowing for a potential continuation of the upward move. Our analysis projects a move towards a primary target of $120,330. This prediction is based on a confluence of technical factors, including the successful hold of a strong support zone and the momentum following a clear breakout.
Current Market Structure and Price Action
The current market structure is bullish, characterized by a series of higher highs and higher lows. The price recently achieved a breakout, pushing above a previous significant level, and has since retreated to retest that level as new support. This is a classic bullish market behavior. The price is currently interacting with and holding this strong support zone, indicating that buyers are defending this level aggressively. The recent price action shows low volatility compression within this zone, suggesting that a significant move, likely to the upside, is being prepared.
Identification of the Key Support Zone
The most critical technical element on the chart is the Strong Support Zone that the price is currently testing. The strength of this zone is derived from:
- Technical Confluence: The zone aligns with the breakout level. A previous resistance level, once broken, often transforms into a strong support level. This is a fundamental principle of technical analysis (role reversal) and adds significant weight to its importance.
- Market Psychology: This area represents a point where the sentiment of sellers who missed the initial breakout and buyers looking for a dip converge. The successful defense of this zone would reinforce bullish confidence and likely trigger a new wave of buying activity.
This confluence makes it a high-probability level for a bullish reaction and a potential launch pad for the next leg up.
Technical Target and Rationale
Our analysis identifies the following price target:
Primary Target (PT1): $120,330
Rationale: This target is derived from technical indicators present on the chart. The specific value of $120,330 suggests it is likely a calculated target from a tool like a Fibonacci extension (e.g., 1.618 level) or a measured move target based on the amplitude of the previous impulsive wave that led to the breakout. It acts as a logical profit-taking zone and a significant psychological level.

Prediction: We forecast that the price will hold the current strong support zone and initiate a fresh bullish impulse wave, moving towards our primary target at $120,330.
Risk Management Considerations
A professional strategy is defined by its risk management. No trade setup is complete without a clear invalidation point.
- Invalidation Level (Stop-Loss): The entire bullish thesis is invalidated if the price achieves a sustained break (e.g., a 4-hour or daily close) below the strong support zone. A precise level would be a close below the lowest wick of the consolidation range within this zone. This would indicate a failure of the breakout and a potential bull trap, signaling a likely deeper retracement.
- Position Sizing: Any long positions taken should be sized so that a loss triggered at the invalidation level represents a small, pre-defined percentage of your total capital (e.g., 1-2%).
Fundamental Backdrop
The technical setup is framed by the current fundamental landscape:
- Macroeconomic Factors: Continued institutional adoption through ETFs and evolving regulatory clarity provide a strong foundational narrative for Bitcoin.
- Network Strength: Sustained high hash rate and network activity underscore the security and utility of the blockchain.
- Market Sentiment: Overall sentiment remains cautiously optimistic, with the market looking for cues for the next significant directional move.
These factors contribute to a neutral-to-bullish fundamental backdrop that supports the potential for a technical rally.
Conclusion
Bitcoin is at a technical inflection point, testing a crucial support level following a bullish breakout. The weight of evidence suggests a bullish resolution, targeting a move to $120,330. Traders should monitor for a confirmed bounce from the current support zone with increasing volume. Risk must be managed diligently by respecting the key invalidation level below the support zone. The reaction at the $120,330 target will be crucial for determining the next major directional move.
Chart Source: TradingView
Disclaimer: This analysis is for informational and educational purposes only and does not constitute financial advice or a recommendation to buy or sell any security. All trading and investing involves significant risk, including the possible loss of your entire investment. Always conduct your own research (DYOR) and consider seeking advice from an independent financial professional before making any trading decisions.


