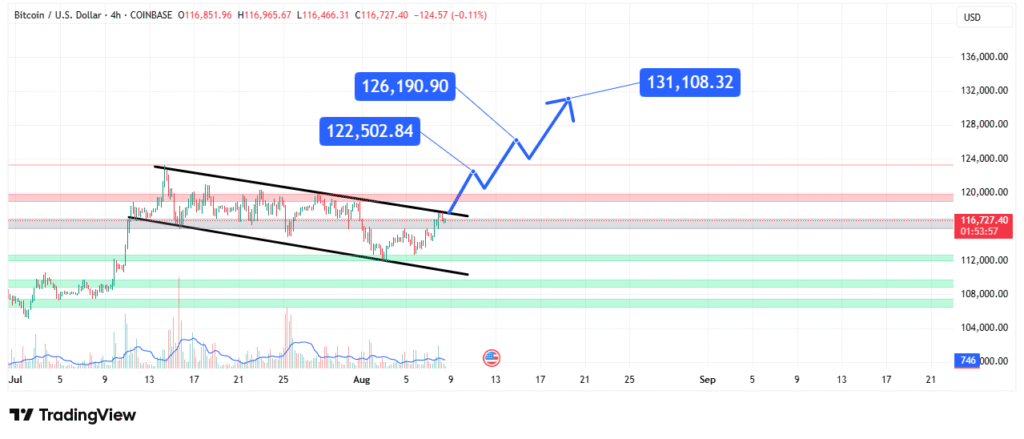
BTC Set to Hit $131K This Month Key Price Analysis
The provided chart, titled “Bitcoin / U.S. Dollar · 4h · COINBASE,” offers a snapshot of Bitcoin’s price movements over a 4-hour timeframe, as traded on the Coinbase exchange. The data reveals key metrics such as the opening price (0116,851.96), high (116,965.67), low (116,466.31), and closing price (116,727.40), along with a slight decline of 124.57 (-0.11%). This analysis will delve into the chart’s details, exploring price trends, support and resistance levels, and potential future movements for Bitcoin.
Current Price and Immediate Trends
At the time of the chart’s capture, Bitcoin was trading at 116,727.40 USD, reflecting a minor dip of 0.11% from the previous close. The 4-hour candlestick shows a relatively tight range, with the high at 116,965.67 and the low at 116,466.31, indicating subdued volatility during this period. The closing price near the middle of the range suggests a lack of strong directional momentum, leaving the market in a state of indecision.
The chart spans from early July to mid-September, providing a broader context for Bitcoin’s performance. Notably, the price has fluctuated between 112,000.00 USD and 136,000.00 USD, with key levels of support and resistance emerging. The upper boundary of this range, around 136,000.00 USD, has acted as a significant resistance level, while the lower boundary near 112,000.00 USD has provided support.
Key Support and Resistance Levels
The chart highlights several critical price levels that traders should monitor:
- Resistance Levels: The upper resistance is evident near 136,000.00 USD, a level that Bitcoin has struggled to breach. Additional resistance levels can be observed at 132,000.00 USD and 128,000.00 USD, where previous price rejections have occurred.
- Support Levels: On the downside, 116,727.40 USD serves as immediate support, followed by stronger support at 112,000.00 USD. The latter has historically acted as a floor, preventing further declines.

The presence of these levels suggests that Bitcoin is currently trading within a defined range, and a breakout above or below these boundaries could signal the next major trend.
Volume and Market Sentiment
The chart does not explicitly display trading volume, but the tight price range and minimal percentage change (-0.11%) hint at low trading activity during this period. Low volume often accompanies consolidation phases, where traders await clearer signals before committing to large positions.
Market sentiment appears neutral, with neither bulls nor bears dominating. However, the proximity to the lower end of the range (112,000.00 USD) could attract buyers, while a failure to hold above 116,000.00 USD might invite further selling pressure.
Future Outlook
For Bitcoin to resume an upward trajectory, it must convincingly break above the 128,000.00 USD resistance and target the 136,000.00 USD high. Conversely, a drop below 112,000.00 USD could lead to a test of lower support levels, potentially around 108,000.00 USD or even 104,000.00 USD.
Traders should watch for:
- Breakouts: A decisive move above 128,000.00 USD or below 112,000.00 USD could dictate the next trend.
- Volume Surges: Increased trading volume accompanying a breakout would validate the move.
- Macro Factors: External influences, such as regulatory news or macroeconomic shifts, could disrupt the current range-bound behavior.
Conclusion
The 4-hour Bitcoin price chart reveals a market in consolidation, with clear support and resistance levels defining the current range. While the short-term trend shows minor bearish pressure, the broader context suggests a wait-and-see approach among traders. A breakout from this range will likely determine Bitcoin’s next significant move, making it crucial for investors to monitor key levels and accompanying volume. As always, risk management and staying informed about market developments remain essential in navigating Bitcoin’s volatile landscape.


