Dow Jones Price Prediction Key Support and Resistance Levels to Watch
The Dow Jones Industrial Average has stalled into a well-defined resistance shelf after a multi-week recovery. On the four-hour chart, repeated probes into the same overhead zone have failed to attract follow-through buying, while candles are starting to print lower highs, classic early signs of distribution. In this context, my base case shifts to a controlled pullback toward successive demand layers. I am publishing three clear downside targets, 44,216, 43,903, and 43,308 USD, that reflect where I expect liquidity to pool and buyers to attempt defense.
Current Market Overview
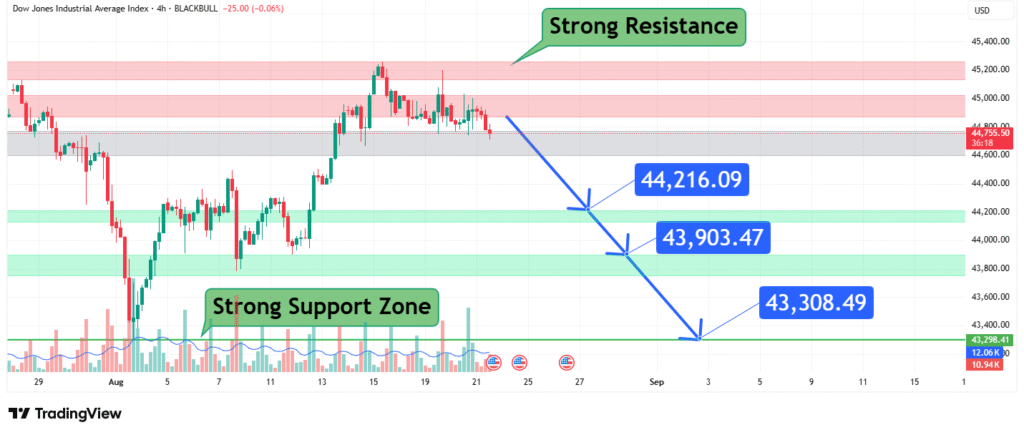
The Dow Jones Industrial Average Index (DJIA) is currently struggling to break above a strong resistance zone around 44,800–45,200 USD. After multiple attempts, the index has failed to sustain higher levels, indicating bearish pressure is building. Sellers are taking control at the top, while buyers are losing momentum.
The chart clearly shows a consolidation phase under resistance, followed by a minor breakdown. If this selling pressure continues, the index is likely to test lower support levels in the short term.
Strong Resistance Zone
The highlighted red area between 44,800–45,200 USD represents a strong resistance zone. Every time the price approaches this level, it faces heavy selling pressure, preventing further upward movement. Unless the index breaks and sustains above this zone, the bullish momentum remains capped.
This resistance level will play a crucial role in deciding whether the Dow can resume its uptrend or extend its pullback.
Strong Support Zone
On the downside, the green support area between 43,200–44,200 USD is acting as a strong support zone. This level has previously held well, attracting buyers whenever the index approached it. However, repeated testing of support without a strong bounce usually signals weakening demand.
If the index revisits this zone, traders should monitor closely whether buyers step in again, or if the zone gives way to further downside.
Predicted Target Levels
Based on technical analysis, the next target price levels are:
- 44,216 USD – First immediate support level. If this breaks, bearish sentiment will likely strengthen.
- 43,903 USD – A deeper support level within the strong demand zone.
- 43,308 USD – The lowest target in this prediction, where a strong reaction from buyers is expected if the market reaches this point.
These levels align with historical price action and volume analysis, suggesting potential bounce zones if selling pressure persists.
What Traders Should Watch
- Resistance Breakout: A close above 45,200 USD would invalidate this bearish outlook and open the path for higher gains.
- Support Reaction: If the index falls towards 43,308 USD, a strong bounce could occur, making it a key reversal level.
- Volume Confirmation: Increasing selling volume near resistance indicates distribution, while rising volume near support could confirm accumulation.
Conclusion
The Dow Jones Industrial Average Index is currently under pressure after failing to break above strong resistance. With downside targets set at 44,216, 43,903, and 43,308 USD, traders should remain cautious and watch for reactions at these critical levels. A sustained move above 45,200 would shift the outlook back to bullish, but until then, the short-term bias remains bearish.
Chart Source: TradingView
Disclaimer: This analysis is based on technical patterns and is for informational purposes only. It does not constitute financial advice. Trading commodities involves significant risk, and you should conduct your own research before making any investment decisions.
How did this post make you feel?
Thanks for your reaction!
