
Ethereum (ETH) Price Analysis Bearish Breakdown Targets $3,900 Support
Ethereum’s price has broken down decisively from a consolidation pattern between approximately $4,500 and $4,900. This breakdown suggests a bearish bias is firmly in control. Our analysis projects a move towards a primary target of $4,100 and a secondary target at the major support zone of $3,900. This prediction is based on a confluence of technical factors, including a break of key support and a measured move target from the recent distribution pattern.
Current Market Structure and Price Action
The current market structure on the daily chart has turned bearish. The price has established a clear lower high near $4,888 and has now broken below the significant support level at $4,500. This level had previously acted as both resistance and support, making its breach a significant event. The price is currently trading around $4,306, which appears to be a minor interim level. The series of recent red candles with increasing volume on the breakdown indicates strong selling pressure, with no significant bullish rejection visible yet.
Identification of the Key Support and Resistance Zones
The most critical technical elements are the broken support-turned-resistance zone and the upcoming demand zones.
- Key Resistance (New Ceiling): The zone between $4,500 and $4,600 is now the primary resistance. A successful retest of this level from below would confirm its new role as a ceiling and could catalyze the next leg down.
- Primary Support Target (PT1): The $4,100 level is the first major target. This level has historical significance as a previous consolidation area in early September and represents a psychological round number.
- Secondary Support Target (PT2): The $3,900 zone is a stronger, more significant historical support level. It aligns with the major swing low from late August and would represent a full retracement of the late September/early October rally.
Technical Target(s) and Rationale
Our analysis identifies the following price targets:
- Primary Target (PT1): $4,100
Rationale: This is the most immediate target based on the measured move of the recent breakdown from the $4,500-$4,900 range. It also represents a prior area of consolidation, often acting as a strong support. - Secondary Target (PT2): $3,900
Rationale: This is a stronger historical support zone. A move to this level would represent a deeper correction and would likely be a make-or-break level for the medium-term bullish trend. It is a high-probability target for a larger wave down.
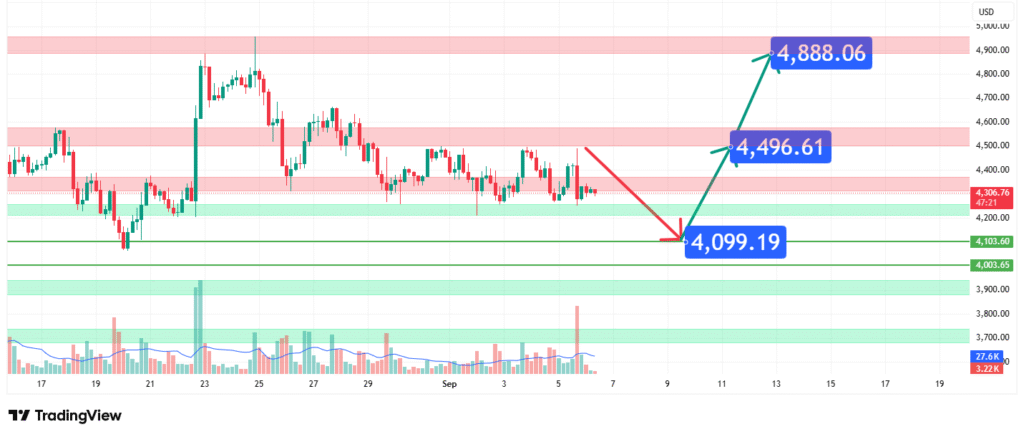
Prediction: We forecast that the price will continue its descent from the current level, encountering minor bounces along the way, ultimately targeting PT1 at $4,100. A break below this level would then open the path towards the major support at PT2, $3,900.
Risk Management Considerations
A professional strategy is defined by its risk management.
- Invalidation Level (Stop-Loss): The entire bearish thesis is invalidated if the price achieves a daily close above $4,600. This level represents a break back into the prior consolidation range and would signal that the breakdown was a false bear trap (fakeout). A more conservative invalidation level would be a break above the recent lower high near $4,888.
- Position Sizing: Any short positions taken should be sized so that a loss triggered at the $4,600 invalidation level represents a small, pre-defined percentage of your total capital (e.g., 1-2%).
Fundamental Backdrop
The technical setup is framed by the current fundamental landscape:
- Macroeconomic Pressure: Broader financial markets are facing headwinds from persistent inflation and expectations of prolonged higher interest rates from the Federal Reserve, which negatively impacts risk-on assets like cryptocurrency.
- Bitcoin Correlation: ETH continues to show a high correlation to Bitcoin (BTC). Any significant moves in BTC, driven by its own technicals or macro factors (like ETF news), will directly influence Ethereum’s price trajectory.
- Network Activity: While technicals are bearish short-term, monitoring on-chain metrics like Total Value Locked (TVL) and network usage remains crucial for the long-term health of the Ethereum ecosystem.
Conclusion
Ethereum is at a technical inflection point following a clear breakdown below $4,500. The weight of evidence suggests a bearish resolution, targeting a move first to $4,100 and potentially extending to $3,900. Traders should monitor for any potential dead cat bounces that get sold into at the new resistance zone ($4,500-$4,600). Risk must be managed diligently by respecting the key invalidation level above $4,600. The reaction at the $3,900 support zone, should it be reached, will be crucial for determining the next major directional move.
Chart Source: TradingView
Disclaimer: This analysis is for informational and educational purposes only and does not constitute financial advice or a recommendation to buy or sell any security. All trading and investing involves significant risk, including the possible loss of your entire investment. Always conduct your own research (DYOR) and consider seeking advice from an independent financial professional before making any trading decisions.
