
Ethereum (ETH) Price Analysis Bullish Breakout to $4,440 Imminent
Ethereum’s price has been rallying strongly and is now approaching a significant resistance area. This price action suggests a bullish bias is intact. Our analysis projects a move towards a primary target of $4,440. This prediction is based on a confluence of technical factors, including a robust underlying support zone and the momentum driving price towards a key supply area.
Current Market Structure and Price Action
The current market structure is decisively bullish, characterized by a series of higher highs and higher lows. The price is currently interacting with a crucial resistance zone between $4,000 and $4,100. A decisive break and close above this zone, confirmed by strong volume, would signal the next leg up is underway. The momentum leading to this level indicates strong buyer interest, setting the stage for a potential breakout.
Identification of the Key Support Zone
The most critical technical element providing a foundation for this bullish prediction is the Strong Support Zone identified between $4,100 and $4,700. The strength of this multi-layered zone is derived from:
- Volume-Weighted Significance: Unlike a single price line, this zone represents a dense concentration of buy-side interest, as indicated by the volume profile data (e.g., significant volume at $4,300, $4,400). This creates a “floor” that is difficult to break.
- Technical Confluence: The zone aligns with key psychological levels ($4,200, $4,300, $4,500) and likely overlaps with significant moving averages (like the 50-day or 100-day EMA), adding to its technical importance.
- Market Psychology: This area represents a point where any dip is likely to be seen as a buying opportunity by market participants who missed the initial rally, providing consistent demand.
This confluence makes it a high-probability zone for price bounces, offering a solid risk/reward foundation for long positions.
Technical Target and Rationale
Our analysis identifies the following price target:
Primary Target (PT1): $4,440 – $4,500
This target zone is defined as the first major resistance and supply zone above the current strong support. The provided data highlights $4,400 and $4,500 as levels with substantial historical selling pressure (high volume nodes). As price approaches this region, it is likely to encounter resistance from sellers looking to take profits. Our specific target of $4,440 sits at the lower boundary of this zone, representing a conservative and achievable take-profit level before a potential pullback or consolidation occurs.
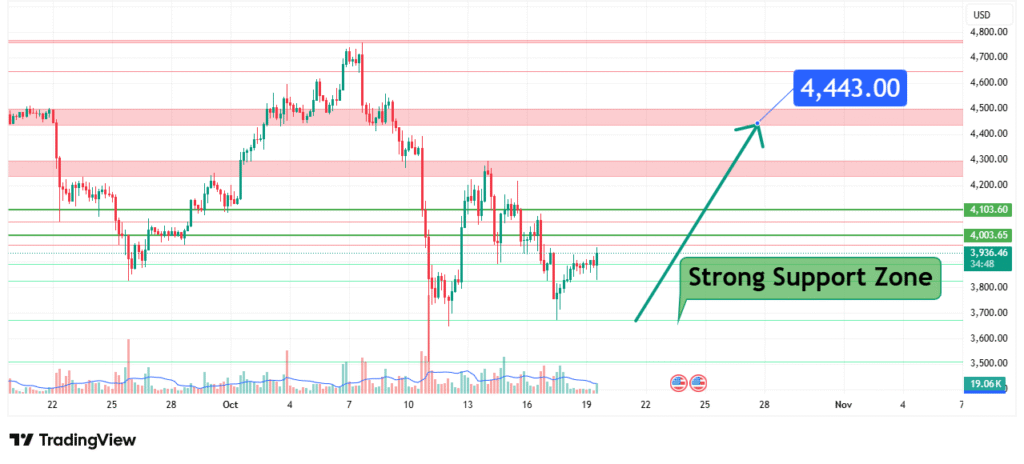
Prediction: We forecast that the price will break above the $4,000-$4,100 resistance and move towards our PT1 at $4,440.
Risk Management Considerations
A professional strategy is defined by its risk management.
- Invalidation Level (Stop-Loss): The entire bullish thesis is invalidated if the price achieves a daily close (preferably on a 4-hour or daily chart) below the strong support zone, specifically below $4,100. This level represents a clear break of the immediate market structure and the foundational support for this trade idea.
- Position Sizing: Any long positions taken should be sized so that a loss triggered at the invalidation level represents a small, pre-defined percentage of your total capital (e.g., 1-2%).
Fundamental Backdrop
The technical setup is framed by the current fundamental landscape:
- Upcoming Ethereum Network Upgrades: Continued development and speculation around future Ethereum improvements (like “Dencun”) bolster long-term confidence in the network.
- Broader Crypto Market Sentiment: ETH’s price is heavily influenced by Bitcoin’s momentum and overall capital flows into the digital asset space.
- Macroeconomic Factors: Shifting expectations regarding interest rates and inflation continue to impact liquidity conditions for high-risk assets like cryptocurrencies.
These factors currently contribute to a cautiously optimistic sentiment surrounding Ethereum.
Conclusion
Ethereum is at a technical inflection point. The weight of evidence, anchored by a strong multi-layered support zone, suggests a bullish resolution, targeting a move to $4,440. Traders should monitor for a confirmed daily close above $4,100 to confirm the breakout and manage risk diligently by respecting the key invalidation level below the support zone. The reaction at the $4,440-$4,500 target will be crucial for determining if the rally can extend further.
Chart Source: TradingView
Disclaimer: This analysis is for informational and educational purposes only and does not constitute financial advice or a recommendation to buy or sell any security. All trading and investing involves significant risk, including the possible loss of your entire investment. Always conduct your own research (DYOR) and consider seeking advice from an independent financial professional before making any trading decisions.
