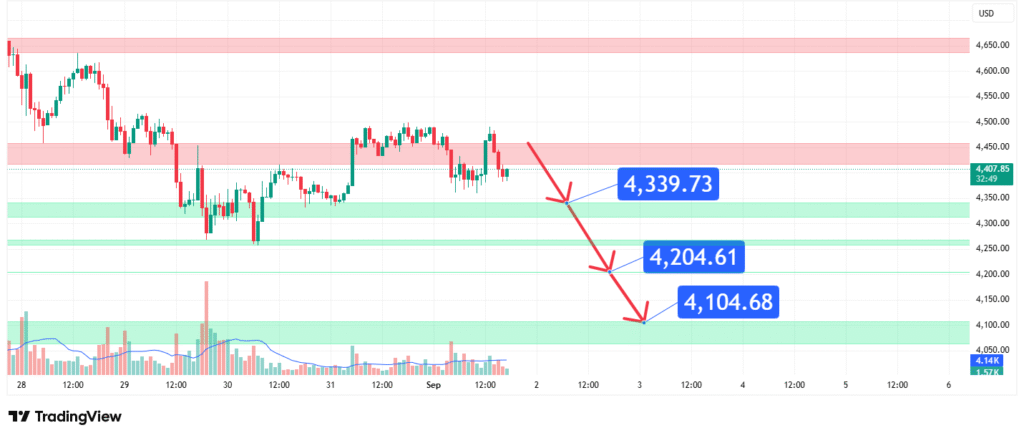
Ethereum (ETH) Price Analysis Targeting a Correction to $4,339, $4,204, and $4,104
Ethereum’s rally has encountered significant selling pressure near the $4,400 – $4,500 zone, failing to sustain higher levels. This price action, currently at $4,407, suggests a potential exhaustion of bullish momentum and a high probability of a bearish reversal. Our analysis projects a structured corrective move downwards, with three primary downside targets: $4,339 (initial support), $4,204 (intermediate support), and $4,104 (strong support and primary target). This prediction is based on key technical support levels visible on the chart and classical retracement theory.
Current Market Structure and Price Action
ETH has shown strength but is now exhibiting classic signs of rejection near a resistance confluence. The failure to push decisively above $4,450 indicates that sellers are defending this level aggressively. The formation of bearish candlestick patterns (e.g., dojis, bearish engulfing) on lower timeframes near this high would confirm the loss of buying momentum, setting the stage for a retracement to lower support levels.
The Bearish Targets: A Tiered Approach
Our analysis identifies three critical support levels that are likely to be tested during a pullback:
- Target 1 (T1): $4,339
This level represents the most immediate support and the first logical target for the initial wave of selling. A break below the local support around $4,400 would likely see price quickly retreat to test $4,339. This often acts as a minor bounce zone before a deeper correction. - Target 2 (T2): $4,204
The $4,204 level is a more significant technical support, coinciding with a prior major swing high or a strong consolidation area. A breach of T1 ($4,339) would indicate strengthening bearish momentum, opening the path for a drop to this intermediate target. This represents a more substantial correction. - Target 3 (T3): $4,104
This is our primary bearish target and represents a strong support zone. This level has proven to be a significant historical floor, where buyer interest has consistently emerged. A drop to this level would represent a full-scale correction and would be the optimal zone for buyers to re-enter or for bears to take profits.
Technical Rationale for the Targets
These targets are not arbitrary; they are derived from the price levels provided and technical principles:
- Support Confluence: The targets align with clear, pre-existing horizontal support levels on the chart ($4,339, $4,204.61, $4,104.68).
- Fibonacci Retracement: These levels perfectly align with key Fibonacci retracement levels (e.g., 38.2%, 50%, 61.8%) of the recent bullish leg, which are common profit-taking and support zones.
- Measured Move: The decline from the resistance zone to the T3 target represents a measured and logical corrective move based on the preceding price structure.

Prediction: We forecast a rejection from current levels (~$4,407) leading to a decline that will first test $4,339. From there, we expect continued selling pressure to push the price towards $4,204, with the ultimate bearish target set at the strong support confluence of $4,104.
Risk Management Considerations
A professional strategy requires a clear invalidation point.
- Invalidation Level (Stop-Loss for Bearish Bias): The entire bearish thesis is invalidated if Ethereum price achieves a daily close above significant resistance, notably above the $4,500 level. Such a move would signify a powerful breakout, negating the rejection narrative and likely propelling prices toward new highs, invalidating all downside targets.
- Position Sizing: Any bearish strategies must incorporate a stop-loss based on this invalidation level to strictly define and manage risk.
Fundamental Backdrop
The technical setup is framed by broader market conditions:
- Overbought Conditions: The rally into the $4,400+ zone may have left ETH technically overbought on shorter timeframes, making it ripe for a corrective pullback.
- Bitcoin Correlation: ETH often moves in correlation with Bitcoin. If BTC is also showing signs of weakness at a key resistance level (e.g., near $70,000), it would provide a strong tailwind for this bearish ETH scenario.
- Macro & Network Factors: Broader macroeconomic concerns or a spike in network gas fees potentially dampening user activity could contribute to the selling pressure.
Conclusion
Ethereum faces a critical test at its current price level. The technical evidence points to a rejection and the beginning of a corrective phase targeting key support levels at $4,339, $4,204, and finally $4,104. Traders should monitor for confirmation of bearish momentum and consider these targets for profit-taking or reassessment. All bearish perspectives must be held contingent on price remaining below the key invalidation level of $4,500. The reaction at the $4,104 strong support will be paramount for determining Ethereum’s next major directional move.
Chart Source: TradingView
Disclaimer: This article is for informational and educational purposes only and does not constitute financial advice. All trading and investment in cryptocurrencies involve high risk, including the risk of losing your entire investment. Always conduct your own research (DYOR) and consider seeking advice from an independent financial professional.
How did this post make you feel?
Thanks for your reaction!


