Flare (FLR) Eyes $0.028 Breakout Critical Support Levels to Watch
The Flare (FLR/USD) price chart reveals a cryptocurrency testing crucial support levels as it attempts to build momentum toward our $0.028 target. Currently consolidating near the lower bounds of its recent trading range, FLR presents both technical opportunities and risks for traders. This analysis examines the key support and resistance levels that will determine whether FLR can stage a meaningful recovery or face further downside pressure.
Current Market Position and Price Structure
Flare’s price action shows the asset navigating a delicate technical landscape:
- Current Trading Range: $0.020-$0.028 (40% price span)
- Immediate Support: $0.02300 holding tentative bids
- Major Support Cluster: $0.02000-$0.02200 (critical zone)
- Upper Resistance: $0.02800 (immediate target)
The compressed trading range between $0.023-$0.026 suggests market indecision, with neither bulls nor bears establishing clear dominance in recent sessions.
Critical Price Levels and Market Framework
Support Structure (Must Hold for Recovery):
- Primary Support: $0.02300 (recent swing low)
- Major Support Zone: $0.02000-$0.02200 (psychological cluster)
- Absolute Floor: $0.01700 (year-to-date low)
Resistance Pathway to Target:
- Initial Hurdle: $0.02500 (recent consolidation high)
- Breakout Level: $0.02600 (technical resistance)
- Primary Target: $0.02800 (15% upside from current range)
- Extension Potential: $0.03000+ upon successful breakout
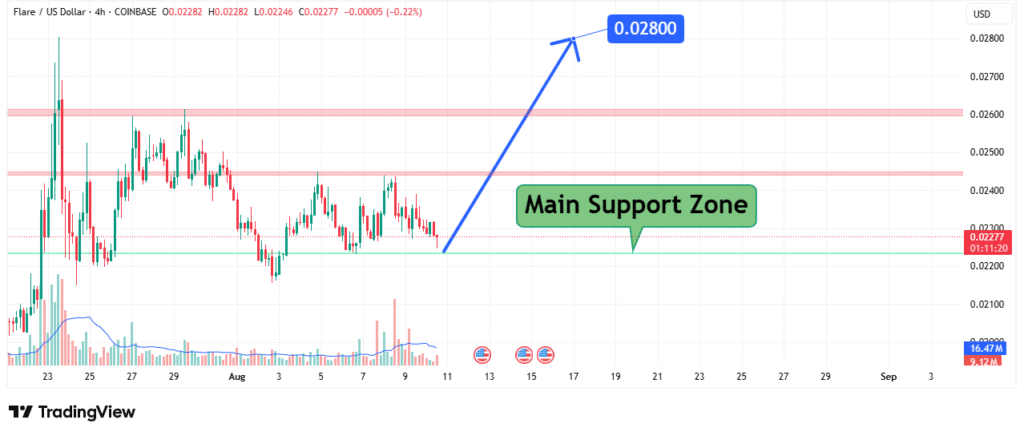
The $0.02800 level represents both a psychological round number and a technical resistance point where previous rallies have stalled.
Technical Considerations and Momentum Factors
Several technical elements shape the current outlook:
- Price Compression: Tightening range suggests impending volatility
- Volume Profile: Below-average activity indicates weak conviction
- Support Strength: Multiple tests of $0.023-$0.022 zone
- Market Structure: Lower highs pattern remains unbroken
The presence of a clearly defined “Main Support Zone” on the chart suggests these levels have historical significance for FLR’s price action.
Potential Price Scenarios and Trading Strategies
Bullish Scenario (Target Achievement):
- Initial Signal: Sustained break above $0.02500
- Confirmation: Volume-backed move past $0.02600
- Target Execution: Test of $0.02800 resistance
- Invalidation: Rejection at $0.02600 with strong selling
Bearish Risk Scenario:
- Warning Sign: Breakdown below $0.02200
- Accelerated Decline: Potential test of $0.02000
- Critical Failure: Close below $0.01700 support
Strategic Trading Approach
For traders targeting $0.028:
- Entry Planning:
- Conservative: Wait for confirmed break above $0.02500
- Moderate: Scale in between $0.023-$0.024 with tight stops
- Aggressive: Current levels with strict risk management
- Stop Placement:
- Below $0.02200 for most positions
- Tighter stops below $0.02300 for aggressive entries
- Profit Targets:
- First take-profit at $0.02600 (partial)
- Final target at $0.02800
- Consider trailing stops beyond $0.026
Key Market Factors to Monitor
- Ecosystem Development: Flare network upgrades/partnerships
- Exchange Listings: New trading pair announcements
- Broader Market Sentiment: Bitcoin dominance and altcoin flows
- On-Chain Metrics: Wallet activity and token distribution
Conclusion: Cautious Optimism with Clear Risk Parameters
Flare presents a technically balanced setup with defined risk-reward parameters. While the path to $0.028 appears achievable if $0.023 support holds, traders should remain mindful of the weak volume profile and broader market conditions. The coming sessions will be crucial in determining whether FLR can gather sufficient buying pressure to challenge upper resistance levels.
