
Floki Price Analysis Key Support Levels & Make-or-Break Moment
The meme coin Floki (FLOKI) is currently testing critical support levels against Tether (USDT), with its price hovering around $0.00010387 after a recent 1.70% drop. This analysis dives deep into the technical setup, crucial support zones, and the fundamental factors that could determine whether Floki stages a recovery or faces further downside. Whether you’re a swing trader, long-term holder, or just tracking meme coins, this guide will help you navigate Floki’s next big move.
Floki’s Current Market Position: Bearish Pressure or Buying Opportunity?
Floki’s 4-hour chart shows a minor pullback, with the price struggling to hold above $0.00010568. Key observations:
- Recent High: $0.00010601 (rejected)
- Recent Low: $0.00010357 (support test)
- Volume: 23.28B FLOKI traded, indicating moderate interest.
The immediate question is: Will Floki rebound from support or break lower?
Critical Support Levels: Where Could Floki Find a Floor?
Floki has multiple support zones that could act as potential reversal points:
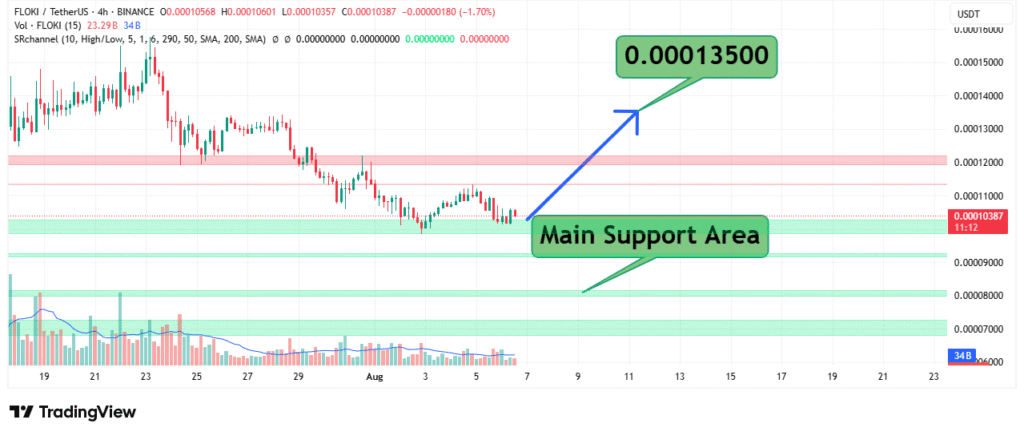
1. Immediate Support: $0.00010357–$0.00010937
- A hold here could signal a short-term bounce.
- A break below may trigger a deeper correction.
2. Strong Historical Support Levels
- $0.00011000 – Psychological round number.
- $0.00010937 – Recent swing low.
- $0.00010500 – Mid-range support.
3. Major Demand Zones (Last Resort for Bulls)
- $0.00009000–$0.00008000 – Strong accumulation area.
- $0.00007000 – Absolute bottom if a severe sell-off occurs.
Key Takeaway: If $0.00010357 fails, the next major defense is $0.00009000.
Resistance Levels: Where Could Floki Face Selling Pressure?
For Floki to regain bullish momentum, it must break through:
- $0.00010601 (recent high) → Breakout confirmation.
- $0.00011000 (psychological barrier).
- $0.00012000–$0.00013000 (previous swing highs).
A decisive close above $0.00011000 could signal a trend reversal.
Technical Indicators: What Do They Suggest?
1. Moving Averages (SMAs)
- 50 SMA vs. 200 SMA: If the 50 SMA crosses above the 200 SMA (“Golden Cross”), it could signal a bullish trend.
- Current SMA alignment suggests consolidation.
2. Volume Analysis
- Declining volume during pullbacks = weak selling pressure.
- Spike in volume on breakout = confirmation of trend strength.
3. Ichimoku Cloud (If Applied)
- Price below cloud = Bearish bias.
- Price above cloud = Bullish momentum.
Fundamental Factors Influencing Floki’s Price
Beyond technicals, Floki’s price depends on:
1. Meme Coin Market Sentiment
- Bitcoin & Ethereum trends often dictate altcoin movements.
- If BTC rallies, meme coins like Floki could see speculative inflows.
2. Floki’s Ecosystem Developments
- Utility expansions (NFTs, DeFi integrations, metaverse projects).
- Exchange listings (new trading pairs boost liquidity).
- Community-driven hype (social media trends, influencer endorsements).
3. Macroeconomic Conditions
- Crypto market correlation with Fed rate decisions.
- Risk-on vs. risk-off sentiment in traditional markets.
Trading Strategies for Floki (FLOKI/USDT)
1. Bullish Scenario (If Support Holds)
- Entry: Near $0.00010357–$0.00010500 with tight stop-loss.
- Target: $0.00011000 → $0.00012000.
- Stop-loss: Below $0.00010000.
2. Bearish Scenario (If Breakdown Occurs)
- Short entry: Below $0.00010357, targeting $0.00009000.
- Stop-loss: Above $0.00011000.
3. Breakout Play (If Resistance is Breached)
- Entry: Above $0.00011000 with volume confirmation.
- Target: $0.00013000+.
Risks & Cautionary Notes
- Low liquidity can cause exaggerated price swings.
- Meme coin volatility means rapid, unpredictable moves.
- Always use stop-losses to manage risk.
Final Verdict: Will Floki Rebound or Drop Further?
Floki is at a critical juncture:
✅ If $0.00010357 holds → Potential bounce to $0.00011000+.
❌ If broken → Next major support at $0.00009000.
Traders should watch:
🔹 Bitcoin’s price action (macro trend setter).
🔹 Floki’s trading volume (breakout confirmation).
🔹 Meme coin social sentiment (Twitter, Telegram hype).
