GBPCAD Price Analysis Bearish Reversal Towards 1.854 and 1.840 Targets
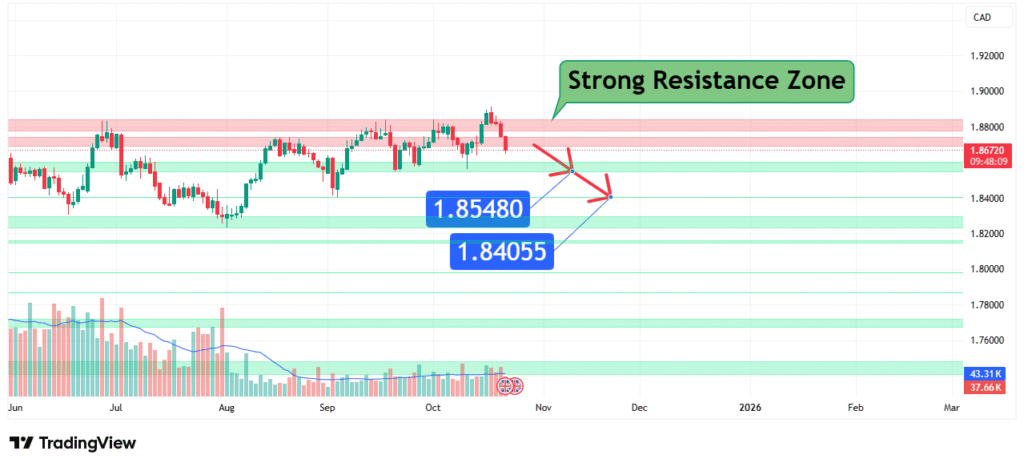
GBPCAD’s price has rallied strongly over recent months but is now confronting a significant and historically proven Strong Resistance Zone between 1.84055 and 1.85480. This price action suggests a bearish bias is forming for a potential pullback or reversal. Our analysis projects a move downwards towards an initial target of 1.854, with a primary target at 1.840. This prediction is based on a confluence of technical factors, primarily the test of a multi-touch resistance zone that has capped rallies for nearly a year.
Current Market Structure and Price Action
The broader market structure for GBPCAD has been bullish, characterized by a consistent upward trend from the lows in early 2024. However, the price is now critically interacting with a ceiling that has defined the upper bound of the trading range for almost a year. The current approach to this zone has occurred with significant momentum, increasing the probability of a classic “rejection” at resistance. Recent price action shows the pair trading near the upper limit of this zone, indicating that a bearish reversal may be imminent as sellers step in at this technically overbought level.
Identification of the Key Resistance Zone
The most critical technical element is the Strong Resistance Zone between 1.84055 and 1.85480. The strength of this zone is derived from:
- Historical Significance: As the chart clearly illustrates, this zone has acted as a major resistance on multiple occasions over the past year (e.g., June, July, August 2023, and March 2024). Each touch has resulted in a significant bearish reaction.
- Technical Confluence: The zone is not a single line but a band containing two precise technical levels (1.84055 and 1.85480), creating a dense area of supply.
- Market Psychology: This area represents a clear psychological and technical barrier where long positions are likely taken profit on, and new short positions may be initiated, creating a concentration of selling pressure.
This multi-touch confluence makes it a high-probability level for a bearish reaction.
Technical Target(s) and Rationale
Our analysis identifies the following price targets for the anticipated decline:
Initial Target (T1): 1.854
This level represents the lower boundary of the resistance zone. A break below the recent consolidation low would likely see a quick test of this level, which may now act as initial support. A break below it confirms the bearish momentum.
Primary Target (PT): 1.840
This is a stronger support level and the base of the resistance zone. A move to this level would represent a full retracement back to the breakout point and is a common profit-taking target for short positions initiated at the higher resistance.

Prediction: We forecast that the price will face strong rejection from the 1.85480-1.8670 area and move down towards our initial target at 1.854. A sustained break below this level would likely accelerate the decline towards our primary target at 1.840.
Risk Management Considerations
A professional strategy is defined by its risk management.
- Invalidation Level (Stop-Loss): The entire bearish thesis is invalidated if the price achieves a decisive daily close above the resistance zone, specifically above 1.8600. A close above this level would indicate a breakout and potential continuation of the bullish trend, negating the reversal setup.
- Position Sizing: Any short positions taken should be sized so that a loss triggered at the invalidation level represents a small, pre-defined percentage of your total capital (e.g., 1-2%).
Fundamental Backdrop
The technical setup is framed by the current fundamental landscape:
- Bank of England (BoE) vs. Bank of Canada (BoC) Policy: The monetary policy divergence between the BoE (which is holding rates higher for longer due to persistent inflation) and the BoC (which is closer to cutting rates) is a key driver. Any shift in this narrative could catalyze the technical move.
- Commodity Prices: The Canadian Dollar (CAD) is heavily influenced by oil prices. A significant drop in crude oil could strengthen the CAD, contributing to the predicted GBPCAD decline.
- UK Economic Data: Upcoming UK inflation and GDP data will be critical. Weaker-than-expected data could weaken the GBP, adding downward pressure to the pair.
These factors create a fundamental environment that can readily support the bearish technical setup.
Conclusion
GBPCAD is at a critical technical juncture, testing a robust and historically significant resistance zone. The weight of evidence suggests a bearish resolution, targeting a decline to 1.854 and potentially 1.840. Traders should monitor for bearish reversal candlestick patterns (e.g., bearish engulfing, shooting star) on the daily chart as a confirmation signal. Risk must be managed diligently by respecting the key invalidation level above 1.8600. The reaction at the 1.840 target will be crucial for determining if this is a deep pullback or the start of a larger corrective phase.
Chart Source: TradingView
Disclaimer: This analysis is for informational and educational purposes only and does not constitute financial advice or a recommendation to buy or sell any security. All trading and investing involves significant risk, including the possible loss of your entire investment. Always conduct your own research (DYOR) and consider seeking advice from an independent financial professional before making any trading decisions.


