Gold Eyes $3,400 Breakout Critical Support Levels to Watch
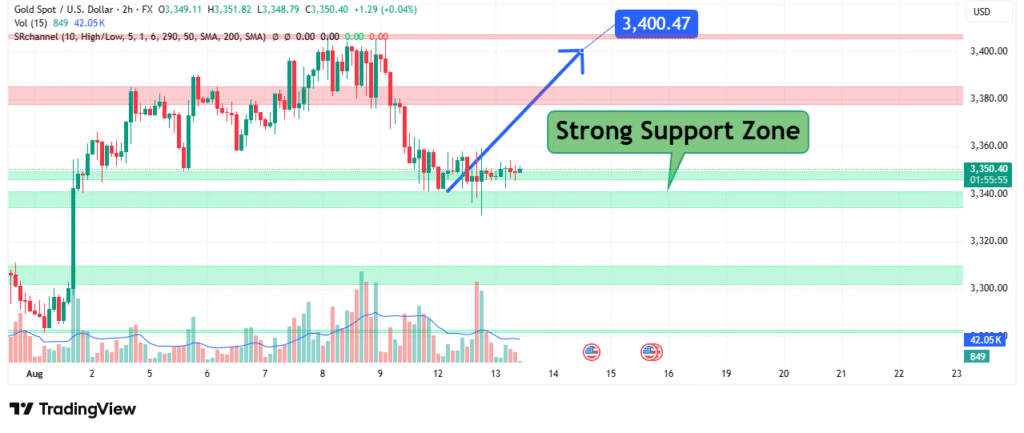
Gold (XAU/USD) is currently testing crucial support levels in its 2-hour chart, trading at $3,350.40 (+0.04%) as it builds momentum toward our $3,400 target. The precious metal shows signs of consolidation after recent gains, presenting traders with a technically compelling setup. This analysis examines the key levels that will determine whether gold can extend its upward trajectory or face potential retracement.
Current Market Position and Price Action
Gold’s technical landscape reveals several important characteristics:
- Current Price: $3,350.40 (up 0.04% in current session)
- Session Range: $3,348.79 (low) to $3,351.82 (high)
- Immediate Support: $3,348 holding firm
- Upper Resistance: $3,360 (recent swing high)
- Primary Target: $3,400.47 (marked significance on chart)
- Volume: Moderate at 849 contracts (~$2.85M equivalent)
The extremely tight trading range ($3.03 spread) suggests market indecision and potential impending volatility expansion.
Critical Price Levels and Market Framework
Support Structure (Must Hold for Bullish Case):
- Primary Support Zone: $3,340-$3,348 (session lows)
- Strong Support Cluster: $3,320-$3,340 (historical levels)
- Major Floor: $3,300 (psychological level)
Resistance Pathway to Target:
- First Hurdle: $3,360 (immediate resistance)
- Key Breakout Level: $3,380 (technical barrier)
- Primary Target: $3,400.47 (1.5% upside from current price)
- Extension Potential: $3,450 upon successful breakout

The $3,400.47 level holds particular importance as it represents both a psychological round number and a technical resistance point where previous rallies have stalled.
Technical Indicators and Momentum Factors
Several technical elements shape the current outlook:
- Price Compression: Extremely tight range signals impending volatility
- Volume Profile: Moderate activity suggests cautious participation
- Moving Averages: SMA (50) and SMA (200) providing dynamic support
- Market Structure: Higher timeframe trend remains bullish
The “Strong Support Zone” marked on the chart between $3,340-$3,360 suggests this area has historical significance for gold’s price action.
Potential Price Scenarios and Trading Strategies
Bullish Scenario (Target Achievement):
- Initial Signal: Break above $3,351.82 session high
- Confirmation: Sustained trading above $3,360
- Target Execution: Test of $3,400.47 resistance
- Invalidation: Rejection at current levels with strong selling
Bearish Risk Scenario:
- Warning Sign: Breakdown below $3,348
- Deeper Correction: Test of $3,320 support
- Critical Failure: Close below $3,300
Strategic Trading Approach
For traders targeting $3,400:
- Entry Strategies:
- Conservative: Wait for break above $3,360
- Moderate: Scale in between $3,348-$3,355
- Aggressive: Current levels with tight stops
- Stop Placement:
- Below $3,348 for short-term trades
- Below $3,340 for swing positions
- Profit-Taking:
- First target at $3,380 (partial)
- Final target at $3,400.47
- Consider trailing stops beyond $3,380
Key Market Factors to Monitor
- Dollar Strength: Inverse correlation with USD
- Risk Sentiment: Safe-haven demand fluctuations
- Inflation Data: Impact on real yields
- Central Bank Policy: Fed rate expectations
- Geopolitical Risks: Global uncertainty factors
Conclusion: Bullish Setup with Clear Technical Parameters
Gold presents a technically sound setup with clearly defined risk/reward parameters. The path to $3,400 appears achievable if $3,348 support holds, though traders should remain cautious given the compressed volatility and need for confirmation. The precious metal’s ability to maintain its strong support zone suggests underlying strength that could fuel another leg higher toward our target.


