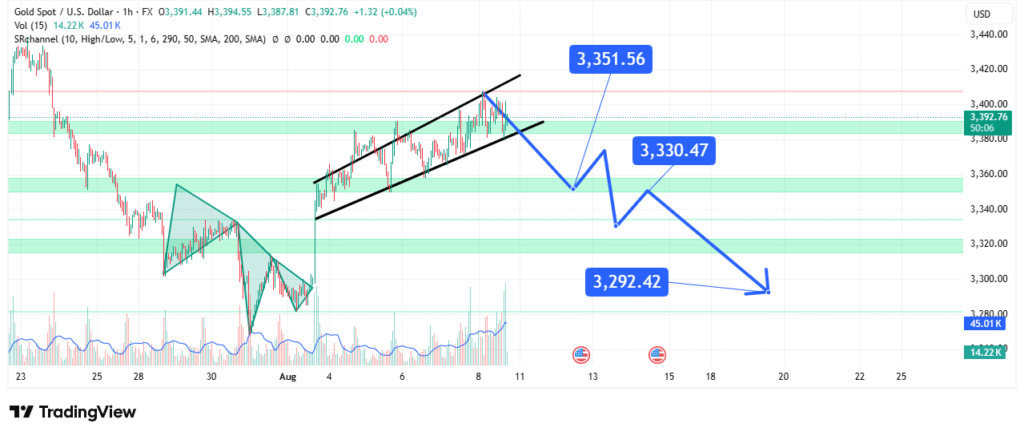
Gold Price Analysis Rising Wedge Signals Potential Bearish Correction
Gold prices are currently trading near $3,392.76, maintaining an upward trajectory in recent sessions. However, the formation of a rising wedge pattern on the 1-hour chart suggests a potential bearish reversal may be on the horizon. This technical setup, combined with key resistance and support levels, provides critical insights for traders preparing for possible short-term price movements.
Current Market Overview
Gold Spot against the US Dollar (XAU/USD) has been recovering steadily from its late-July lows, supported by buying momentum and a series of higher lows. Despite this rally, the market now appears to be approaching an inflection point. The rising wedge pattern, marked by converging trendlines, often indicates weakening bullish momentum, which can lead to a downside breakout.
Technical Structure and Pattern Analysis
The recent uptrend has seen gold prices move within the boundaries of the wedge, with the upper resistance line capping upside advances and the lower trendline offering short-term support. This compression of price action suggests that buyers may be losing strength, leaving the market vulnerable to a sell-off if support breaks.
Volume analysis further supports this cautionary view, as recent upward moves have not been accompanied by significant spikes in buying activity, which is often necessary for sustaining rallies.
Key Levels to Watch
- Resistance: $3,351.56 – This is the nearest resistance point and the upper wedge boundary. A break above it could invalidate the bearish outlook.
- First Support Target: $3,330.47 – This level is the initial downside target if a breakdown occurs.
- Second Support Target: $3,292.42 – A deeper correction could push prices toward this zone, which aligns with previous demand areas.

If the wedge pattern resolves downward, these support levels will be critical in determining the extent of the correction.
Bearish Scenario
Should gold break below the wedge support line, sellers may gain momentum, pushing the market toward $3,330.47 and potentially $3,292.42. Failure to hold the latter could open the door to further declines toward the $3,280 area.
Bullish Alternative
While the primary pattern signals caution, a strong breakout above $3,351.56 with convincing volume could reignite bullish momentum, setting the stage for a push toward the $3,400 psychological mark. However, such a move would require renewed buying strength and favorable market sentiment.
Conclusion
Gold prices are approaching a critical technical point, with the rising wedge pattern hinting at a possible bearish correction. Traders should closely monitor price action near the wedge boundaries, as the next breakout direction will likely define short-term market sentiment. A breakdown targets $3,330.47 and $3,292.42, while a breakout above $3,351.56 could shift momentum back in favor of the bulls.


