How to Read Trading Charts Like a Pro
Want to stop guessing and start making informed trading decisions? Learning how to read trading charts is the single most important skill you can develop. This step-by-step guide will demystify chart analysis, giving you a clear, actionable framework to identify opportunities and manage risk like a professional.
For traders in the US, UK, and other major markets, mastering chart analysis allows you to compete in fast-moving environments like the NYSE, NASDAQ, and LSE, regardless of the asset; stocks, forex, or crypto. A reliable charting platform is essential; many of the best online brokers for active traders, like Interactive Brokers or TD Ameritrade’s thinkorswim, offer powerful, built-in tools.
Summary Table
| Aspect | Detail |
|---|---|
| Goal | To confidently analyze trading charts to identify trends, predict potential price movements, and execute informed trades. |
| Skill Level | Beginner to Intermediate |
| Time Required | 30 minutes to learn the basics; a lifetime to master. |
| Tools Needed | A trading/charting platform (e.g., TradingView, MetaTrader, your broker’s platform). |
| Key Takeaway | Price action and volume tell a story. Learn the language of charts to understand market behavior and act accordingly. |
| Core Concepts |
Why Learning to Read Trading Charts is Crucial
Charts are the footprint of money. They visualize the collective psychology of all market participants; the greed, fear, and indecision, in a graphical format. For a trader, a chart is not just a squiggly line; it’s a real-time battle map.
Trading without understanding charts is like driving blindfolded. You’re relying on luck, emotion, or tips, which is a recipe for consistent losses.
When you learn how to read trading charts, you transition from being a gambler to a strategist. You can identify high-probability entry and exit points, set logical stop-losses, and objectively measure supply and demand. This skill empowers you to build a disciplined, repeatable trading process.
What You’ll Need Before You Start
Knowledge Prerequisites:
- A basic understanding of what you’re trading (e.g., a stock, a currency pair).
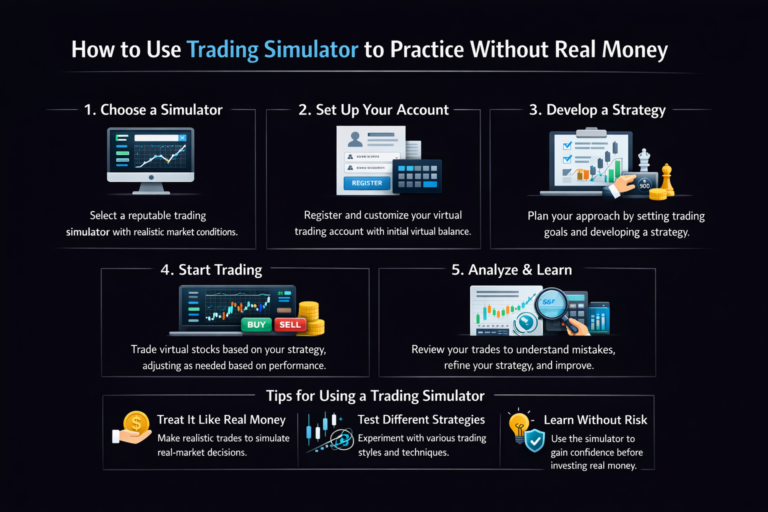
- The patience to learn and practice without risking real money initially.
Tools & Platforms:
You need access to a charting software. Excellent free options are available.
- TradingView: A fantastic web-based platform with extensive tools and a social community. Ideal for beginners and pros alike.
- Your Broker’s Platform: Most brokers like IG or eToro have integrated charts.
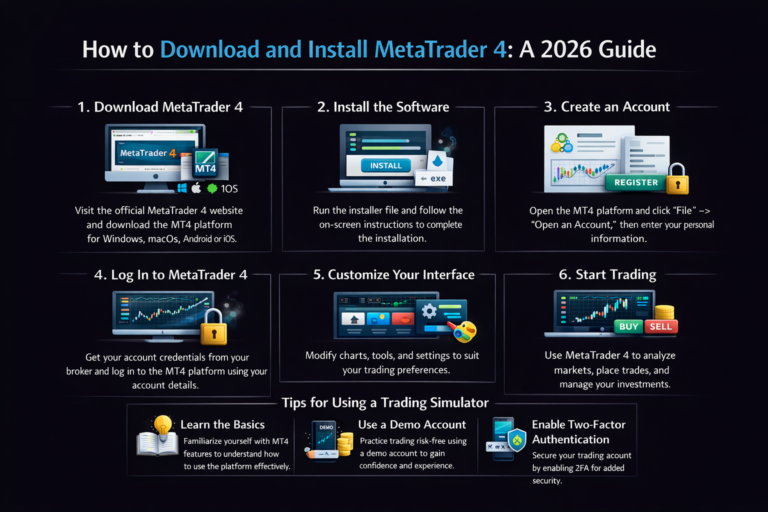
- MetaTrader 4/5 (MT4/MT5): The industry standard for forex traders.
To effectively practice these techniques, you’ll need a platform with robust charting tools. While many great free options exist, serious traders often graduate to professional-grade software. You can compare features and pricing in our dedicated guide to the best charting software for technical analysis.
How to Read Trading Charts: A Step-by-Step Walkthrough
Let’s break down the process of analyzing any chart, from top to bottom.
Step 1: Select Your Chart Type and Timeframe
The first step is to set up your chart correctly. The most common and useful chart type is the Candlestick Chart. Each candle shows the open, high, low, and close (OHLC) for a specific period. Next, choose your timeframe. Are you a long-term investor? Use daily or weekly charts. A day trader? Use 5-minute or 1-hour charts.
Pro Tip: Always start your analysis on a higher timeframe (like the 1-day or 4-hour chart) to identify the primary trend, then drill down to lower timeframes for precise entry points.
Step 2: Identify the Overall Trend
The trend is your friend. Your first job is to determine the market’s direction.
- Uptrend: Categorized by a sequence of Higher Highs (HH) and Higher Lows (HL).
- Downtrend: Characterized by a series of Lower Highs (LH) and Lower Lows (LL).
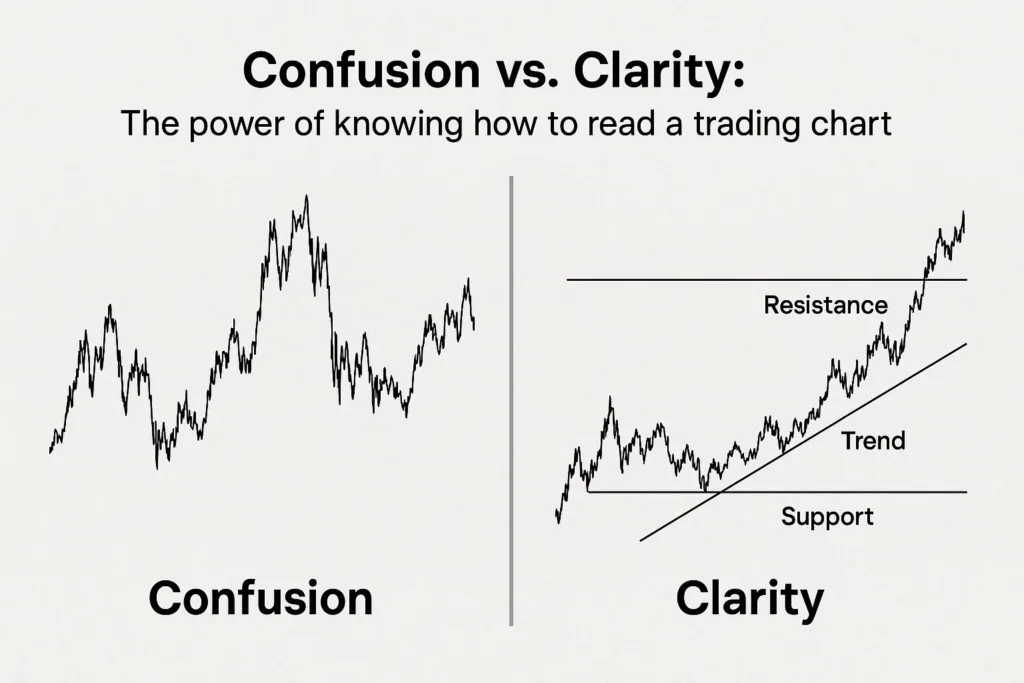
- Ranging/Sideways Market: When price moves horizontally between a clear Support (floor) and Resistance (ceiling) level.
Common Mistake to Avoid: Don’t fight the trend. Trying to pick tops in a strong uptrend or bottoms in a strong downtrend is extremely risky.
Step 3: Draw Key Support and Resistance Lines
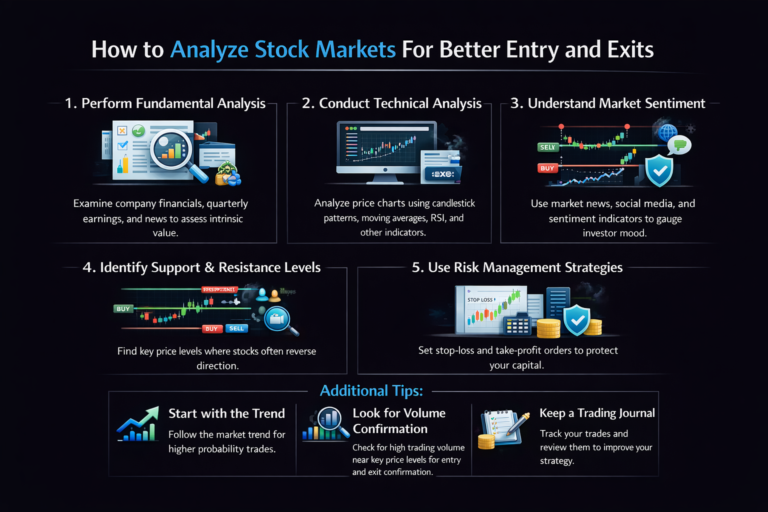
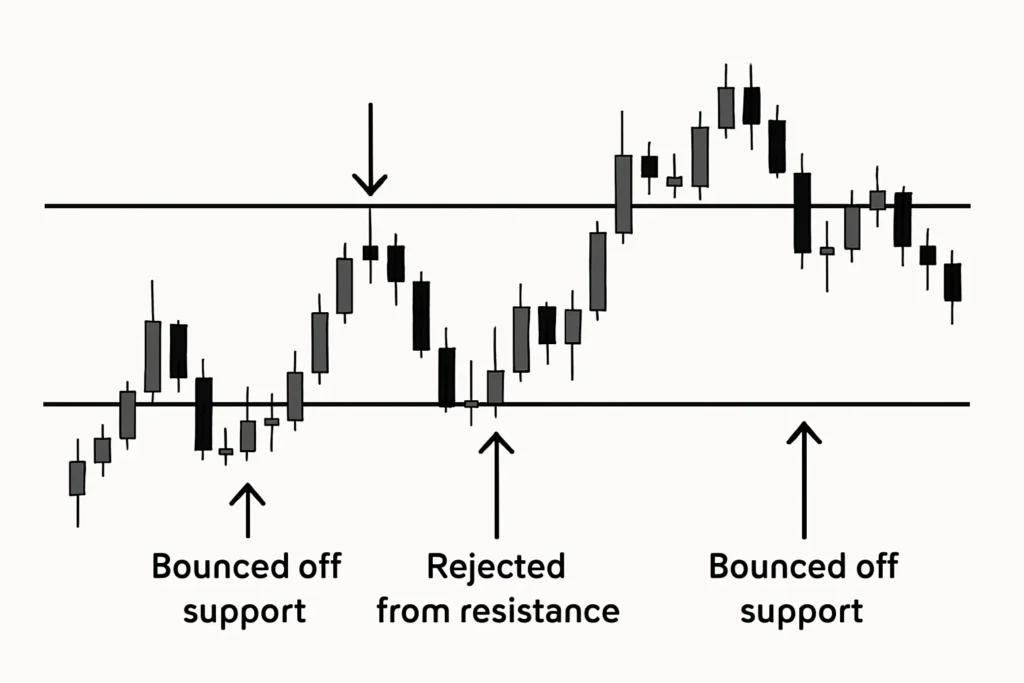
Support is a price level where buying interest is significantly strong enough to overcome selling pressure, causing the price to bounce. Resistance is the opposite, a price level where selling pressure overcomes buying pressure, causing the price to drop. Draw horizontal lines at these key levels.
Pro Tip: The more times a price level has been tested (touched and reversed), the more significant that support or resistance level becomes.
Step 4: Analyze Candlestick Patterns and Volume
This is where you read the market’s short-term narrative.
- Candlestick Patterns: Look for single or multi-candle patterns that indicate potential reversals or continuations. Key reversal patterns include the Hammer (potential bullish reversal at a bottom) and Shooting Star (potential bearish reversal at a top).
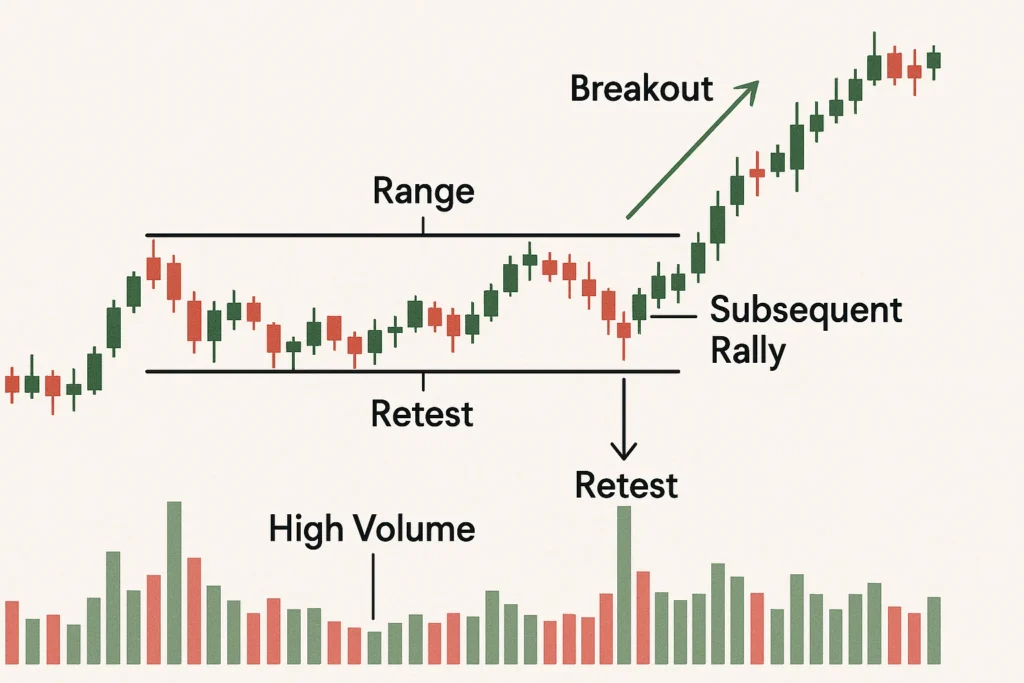
- Volume: This confirms the strength behind a price move. A price breakout with high volume is more likely to be genuine than one with low volume.
Formula (The Story): Price Breakout + Surging Volume = High Conviction Signal.
How to Use Chart Analysis in Your Trading Strategy
Scenario 1: Bounce Play in an Uptrend
You identify a stock in a clear uptrend (HH, HL). It pulls back to a key support level that has held before. You see a bullish hammer candlestick form on that support with above-average volume. This is a high-probability signal to enter a long (buy) trade, with a stop-loss placed just below the support level.
Scenario 2: Breakout and Retest
Price has been trading in a range. It then breaks above the resistance level on huge volume. A few candles later, it pulls back and retests the old resistance level, which now acts as new support. The price holds this level. This is a classic breakout confirmation, offering a potential entry point.
Case Study: In 2023, Tesla (TSLA) broke out of a multi-month consolidation range on massive volume. Traders who identified this breakout and bought the subsequent retest were positioned for a significant upward move, all by applying basic chart reading principles.
The Crowd Psychology Behind the Patterns
Charts are a reflection of mass psychology. Understanding this adds a deeper layer to your analysis.
- Support: Represents a price where buyers perceive value, stepping in aggressively. It’s the line of greed for buyers and fear of missing out for sellers who didn’t sell earlier.
- Resistance: Represents a price where sellers are willing to offload assets and buyers hesitate. It’s the line of fear for buyers and greed for sellers looking to take profit.
- Breakout: Signifies a shift in the psychological balance. The old level of fear (resistance) is overcome by a new level of greed, propelling prices higher.
By thinking in terms of buyer/seller psychology, you can anticipate the strength of a level before price even touches it.
Common Mistakes When Reading Charts
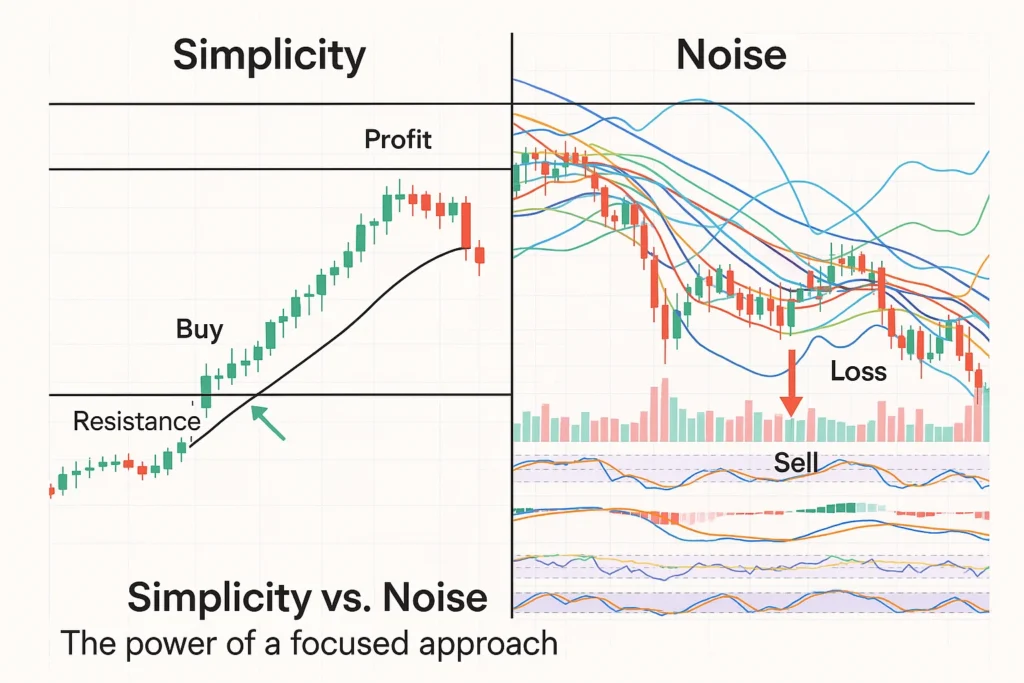
Pitfall 1: Overcomplicating the Chart (Indicator Overload)
- The Mistake: Loading a chart with 10 different indicators that all give conflicting signals.
- The Fix: Start with a clean chart. Focus on pure Price Action (candlesticks), Volume, and key Support/Resistance. Add one or two indicators (like Moving Averages) only once you’ve mastered the basics.
Pitfall 2: Ignoring the Higher Timeframe Trend
- The Mistake: Seeing a buy signal on a 5-minute chart while the daily chart is in a crushing downtrend.
- The Fix: Always, without exception, align your trades with the direction of the higher timeframe trend. It dramatically increases your odds of success.
Pitfall 3: Chasing the Price
- The Mistake: FOMO (Fear Of Missing Out) leads to buying after a huge green candle has already spiked, often right into resistance.
- The Fix: Be patient. The market will always give you another opportunity. Wait for a pullback to support or a consolidation period instead of buying at the top.
- Objective Entry/Exit Points: Provides clear levels for placing trades and managing risk.
- Works on Any Asset/Timeframe: Principles are universal, from 1-minute forex charts to yearly stock charts.
- Focuses on Price: Filters out news and opinions, focusing solely on market behavior.
- Can Predict Short-Term Movements: Excellent for timing entries and exits.
- Self-Fulfilling Prophecy: Many traders watch the same levels, which can make them work collectively.
- Open to Interpretation: Two traders can view the same chart differently.
- Can Be Lagging: Indicators are based on past price movements, so they inherently lag.
- Black Swan Events: Unexpected news can instantly invalidate any technical setup.
Taking Your Chart Reading to the Next Level
Once you’ve mastered the basics, you can incorporate more sophisticated tools:
- Key Indicators: Learn to use the Relative Strength Index (RSI) to identify overbought or oversold conditions and the Moving Average Convergence Divergence (MACD) to gauge momentum shifts.
- Market Structure & Order Flow: Begin to understand how major market players (banks, institutions) place their orders, which often creates the support and resistance levels you see on retail charts. Resources from Babypips are excellent for this.
- Multi-Timeframe Analysis (MTFA): Systematically analyze the same asset across three timeframes (e.g., Weekly for trend, Daily for context, 4-Hour for entry) to make highly-confident trading decisions.
Technical Analysis (Chart Reading) vs Fundamental Analysis
| Feature | Technical Analysis (Chart Reading) | Fundamental Analysis |
|---|---|---|
| Focus | Price action, patterns, and volume | Company financials, industry health, economics |
| Timeframe | Short to Medium-term | Long-term |
| Data Used | Historical price and volume charts | Earnings reports, balance sheets, economic data |
| Primary Goal | Timing the market; predicting price direction | Determining intrinsic value; “buying a great company” |
Conclusion
You now have the foundational framework to look at a trading chart and see more than just random noise. You can identify trends, spot key levels, and understand the basic story of buyer vs. seller conflict. Remember that consistency and risk management are more important than any single trade.
Your action plan is simple:
- Open a free charting platform like TradingView.
- Pick a well-known asset (e.g., Apple – AAPL).
- Go through this step-by-step process: Identify the trend, mark support/resistance, and look for candlestick patterns.
- Practice, practice, practice without real money until the process becomes second nature.
