Litecoin (LTC) Price Analysis Bullish Rebound to Target $135
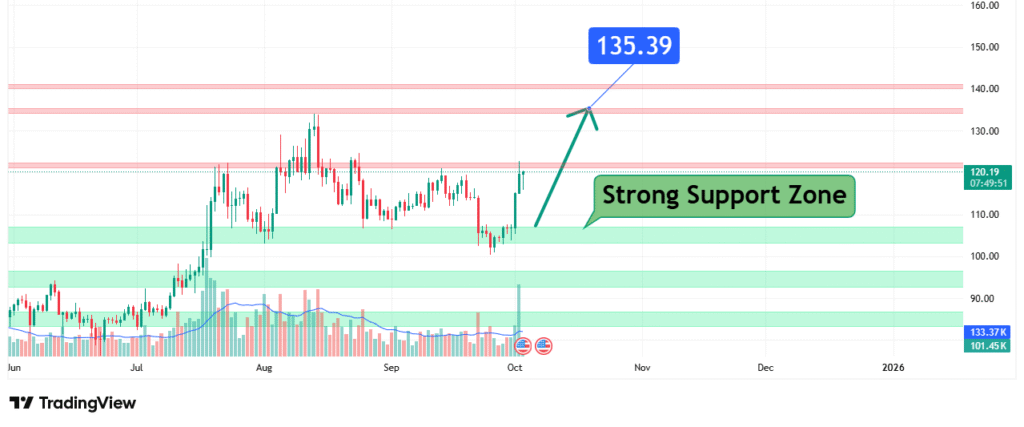
LTC’s price has been in a sustained downtrend but is now showing signs of potential exhaustion as it tests a major historical support zone. This price action suggests a bullish reversal bias is forming. Our analysis projects a corrective wave towards a primary target of $135.39. This prediction is based on a confluence of technical factors, primarily the interaction with a strong support zone and the potential for a trend reversal.
Current Market Structure and Price Action
The broader market structure for LTC has been bearish, characterized by a series of lower highs and lower lows throughout the latter half of the year. However, the price is now interacting with a Strong Support Zone that has held firm since June. The current consolidation and lack of further breakdown at this level indicate that selling pressure may be waning and buyer interest is emerging. This compression often precedes a significant volatility expansion, which, in this context, is likely to be to the upside.
Identification of the Key Support Zone
The most critical technical element is the Strong Support Zone which the price has respected for over five months. The strength of this zone is derived from:
- Historical Significance: This level has acted as a formidable floor since June, with multiple tests resulting in bounces. Each successful hold adds to its technical significance.
- Technical Confluence: The zone represents the absolute lows of the current multi-month cycle. A failure here would open the door to much lower prices, making its defense critical for bulls.
- Market Psychology: This area represents a point of maximum pain for sellers and potential value for buyers. The prolonged consolidation here suggests a battle is underway, and a failure to break lower often leads to a sharp move up as sellers capitulate.
This multi-touch, historically significant support makes it a high-probability level for a strong bullish reaction.
Technical Target and Rationale
Our analysis identifies the following price target:
- Primary Target (PT1): $135.39
- Rationale: The $135.39 level is a key technical target for two primary reasons. First, it represents a ~12.5% gain from the current price, a logical first profit-taking zone for buyers entering at support. Second, and more importantly, it aligns with the first major resistance level that the price would encounter on its way up. A move to this level would signify a break of the immediate bearish structure and test a higher-timeframe equilibrium point.

Prediction: We forecast that the price will bounce from the multi-month support zone and initiate a bullish reversal, moving towards PT1 at $135.39.
Risk Management Considerations
A professional strategy is defined by its risk management.
- Invalidation Level (Stop-Loss): The entire bullish reversal thesis is invalidated if the price achieves a decisive daily close below the strong support zone that has held since June. A break below this foundational level would indicate a complete failure of the bullish defense and likely trigger a new, aggressive wave of selling. The exact price for this would be a break below the most recent swing low within this zone.
- Position Sizing: Any long positions taken should be sized so that a loss triggered at the invalidation level represents a small, pre-defined percentage of your total capital (e.g., 1-2%).
Fundamental Backdrop
The technical setup is framed by the current fundamental landscape:
- Network Activity: Litecoin’s value is often linked to its utility as a payment system and its low transaction fees. Monitoring network hash rate and transaction volume can provide fundamental confirmation for a technical rebound.
- Broader Crypto Market Sentiment: As a major altcoin, LTC’s price is heavily influenced by Bitcoin’s momentum. A stabilization or rally in BTC would provide a strong tailwind for this bullish LTC setup.
- Relative Strength: Traders often watch for signs of LTC outperforming BTC (LTC/BTC pair strength) as a signal of altcoin capital rotation, which could amplify the move.
These factors currently contribute to a cautiously optimistic sentiment for a reversal, supporting the technical outlook.
Conclusion
LTC is at a critical technical juncture, testing a multi-month support zone that must hold to prevent further declines. The weight of evidence suggests a bullish reversal is the path of least resistance, targeting a move to $135.39. Traders should monitor for a confirmed bounce with increasing volume from this support area. Risk must be managed diligently by respecting a break below the support zone as a definitive invalidation signal. The reaction at the $135 target will be key to assessing whether a more sustained recovery is possible.
Chart Source: TradingView
Disclaimer: This analysis is for informational and educational purposes only and does not constitute financial advice or a recommendation to buy or sell any security. All trading and investing involves significant risk, including the possible loss of your entire investment. Always conduct your own research (DYOR) and consider seeking advice from an independent financial professional before making any trading decisions.


