
Natural Gas Price Forecast Bullish Breakout to Target $4.70
Natural Gas’s price has been consolidating in a bullish flag pattern after a strong rally, finding consistent support around the $3.50 area. This price action suggests a bullish bias is forming. Our analysis projects a move towards primary targets of $4.287, $4.493, and $4.699. This prediction is based on a confluence of technical factors, including the formation of a bullish continuation pattern and a bounce from a key support zone defined by the 50-day moving average and a psychological level.
Current Market Structure and Price Action
The current market structure is bullish, characterized by a series of higher highs and higher lows established throughout September and October. The price is currently interacting with a dynamic support zone created by the 50-day moving average and the $3.50 psychological level. Recent price action has shown a period of low volatility compression and consolidation within a descending channel, which is interpreted as a bull flag—a typical continuation pattern. This indicates that a breakout to the upside may be imminent, resuming the prior uptrend.
Identification of the Key Support Zone
The most critical technical element is the Strong Support Zone between $3.50 and $3.40. The strength of this zone is derived from:
- Historical Significance: This level has acted as a major consolidation area and swing point on multiple occasions in recent months, as visible on the provided chart.
- Technical Confluence: The zone aligns perfectly with the 50-day moving average (a key dynamic support) and the powerful psychological round number of $3.50.
- Market Psychology: This area represents a point where sellers have been unable to push the price lower, and buyers have consistently stepped in, indicating a shift in sentiment towards accumulation.
This multi-layered confluence makes it a high-probability level for a bullish reaction and the launchpad for our predicted move higher.
Technical Targets and Rationale
Our analysis identifies the following ascending price targets:
Primary Target (PT1): $4.287
This level represents the initial measured move target, equivalent to the height of the flag pole (the initial rally) projected upward from the breakout point. It also aligns with a previous minor resistance area.
Secondary Target (PT2): $4.493
This acts as a more significant resistance level, coinciding with a previous swing high from early October. A break above PT1 would likely see momentum carry the price to test this zone.
Extended Target (PT3): $4.699
This is our most ambitious target, representing the 1.618 Fibonacci extension of the corrective move within the flag and a key psychological level. A sustained bullish trend would be required to reach this point.
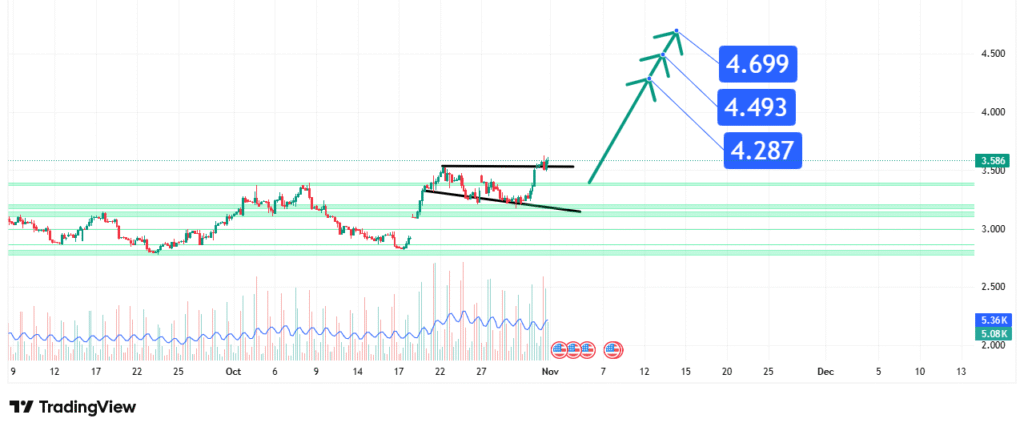
Prediction: We forecast that the price will break above the flag’s upper trendline (near $3.80-$3.90) and move towards PT1 at $4.287. A sustained move beyond that would then open the path towards PT2 at $4.493 and ultimately PT3 at $4.699.
Risk Management Considerations
A professional strategy is defined by its risk management.
- Invalidation Level (Stop-Loss): The entire bullish thesis is invalidated if the price achieves a daily close below the key support zone, specifically at $3.400. This level represents a clear break of the market structure (violating the previous higher low) and the 50-day moving average support.
- Position Sizing: Any long positions taken on a breakout should be sized so that a loss triggered at the $3.40 invalidation level represents a small, pre-defined percentage of your total capital (e.g., 1-2%).
Fundamental Backdrop
The technical setup is framed by the current fundamental landscape:
- Seasonal Demand: We are approaching the winter season in the Northern Hemisphere, which typically increases heating demand and is a fundamentally bullish driver for Natural Gas prices.
- Inventory Reports: Weekly EIA storage reports will be critical. Larger-than-expected drawdowns in inventories will likely fuel the bullish move, while builds could create temporary pullbacks.
- Geopolitical Factors: Ongoing global instability continues to impact energy supply chains, adding a volatility premium to energy commodities like Natural Gas.
These factors contribute to the bullish sentiment surrounding the asset, providing a tailwind for our technical forecast.
Conclusion
Natural Gas is at a technical inflection point, coiling within a bull flag pattern above strong support. The weight of evidence suggests a bullish resolution, targeting a move first to $4.287 and potentially extending towards $4.699. Traders should monitor for a confirmed daily close above the flag’s resistance ($3.85-3.90) to enter and manage risk diligently by respecting the key invalidation level at $3.40. The reaction at the initial target zone will be crucial for determining the strength of the subsequent move.
Chart Source: TradingView
Disclaimer: This analysis is for informational and educational purposes only and does not constitute financial advice or a recommendation to buy or sell any security. All trading and investing involves significant risk, including the possible loss of your entire investment. Always conduct your own research (DYOR) and consider seeking advice from an independent financial professional before making any trading decisions.
