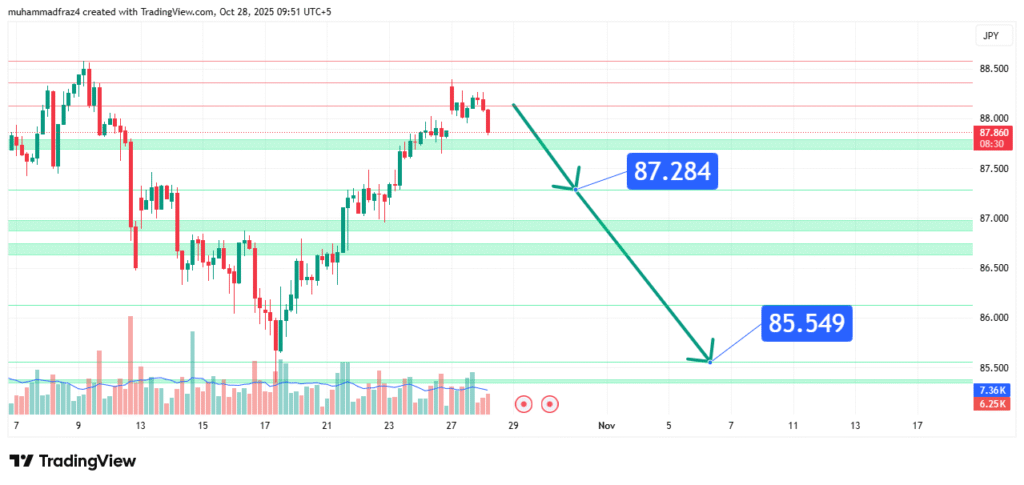
NZDJPY Price Forecast Bearish Momentum Builds Towards Key Supports
NZDJPY has rallied strongly to multi-year highs but is now showing clear technical signs of buyer exhaustion and potential reversal. The price action suggests a bearish bias is forming as the pair tests a significant long-term resistance zone. Our analysis projects a corrective decline towards an initial target of 87.284, followed by a primary target at 85.549. This prediction is based on a confluence of technical factors, including a bearish divergence on the Relative Strength Index (RSI), a potential double-top formation, and a rejection from the upper Bollinger Band.
Current Market Structure and Price Action
The long-term market structure remains bullish, but the short-term structure on the 4-hour chart is showing the first signs of bearish deterioration with a potential break of a minor support trendline. The price is currently interacting with a major resistance zone between 88.000 and 88.200. Recent price action has shown a series of long upper wicks and doji candles near this resistance, indicating indecision and selling pressure at these elevated levels. This price action, following a steep parabolic rise, indicates that a bearish breakdown may be imminent.
Identification of the Key Resistance Zone
The most critical technical element is the Strong Resistance Zone around 88.000 – 88.200. The strength of this zone is derived from:
- Historical Significance: This level represents a multi-year high and an area that has capped advances in the past. The market is naturally cautious at these uncharted or rarely-tested levels.
- Technical Confluence: The zone aligns with the upper Bollinger Band and a key psychological round number at 88.000. Furthermore, the RSI has formed a clear bearish divergence, making lower highs while price made higher highs—a classic reversal signal.
- Market Psychology: This area represents a peak where profit-taking on long-term carry trades becomes increasingly attractive, potentially shifting sentiment from greed to caution.
This powerful confluence makes it a high-probability level for a bearish reaction and the start of a corrective phase.
Technical Targets and Rationale
Our analysis identifies the following price target(s):
- Initial Target (IT): 87.284
- Rationale: This level represents the 38.2% Fibonacci retracement of the most recent impulsive rally and a previous minor swing low that acted as resistance. It is the first logical support and profit-taking zone for a bearish move.
- Primary Target (PT1): 85.549
- Rationale: This level represents the 61.8% Fibonacci retracement of the same rally and a more significant previous consolidation zone. It is the measured move target if the potential double-top pattern is confirmed and represents a key technical objective for a deeper correction.

Prediction: We forecast that NZDJPY will fail to sustain a break above 88.200, leading to a bearish reversal that initially targets 87.284. A sustained break below this level would then open the path for a more significant decline towards our Primary Target at 85.549.
Risk Management Considerations
A professional strategy for a counter-trend move requires strict risk management.
- Invalidation Level (Stop-Loss): The entire bearish thesis is invalidated if the price achieves a daily close above 88.500. This level is placed above the key resistance zone and the recent highs. A break here would signify a continuation of the bullish trend and likely lead to a further squeeze higher.
- Position Sizing: Any short positions taken should be sized so that a loss triggered at the 88.500 invalidation level represents a small, pre-defined percentage of your total capital (e.g., 1-2%).
Fundamental Backdrop
The technical setup is framed by a potentially shifting fundamental landscape for this classic carry trade pair:
- Bank of Japan (BoJ) Intervention Risk: The JPY is at severely weakened levels, raising the specter of intervention by the BoJ to support its currency. Any verbal or actual intervention would cause a sharp, violent decline in NZDJPY.
- Shifting Risk Sentiment: NZD is a risk-sensitive currency. A deterioration in global risk appetite (e.g., equity market sell-off) would weaken the NZD and amplify the pair’s decline.
- RBNZ Dovish Pivot: The Reserve Bank of New Zealand (RBNZ) has signaled the end of its hiking cycle, removing a key pillar of support for the NZD, while markets remain wary of a BoJ policy shift.
These factors contribute to an increasingly vulnerable and bearish-leaning fundamental environment for the pair at current heights.
Conclusion
NZDJPY is at an extreme technical juncture, testing a multi-year resistance zone with clear signs of bullish exhaustion. The confluence of the bearish RSI divergence, reversal candlestick patterns, and heightened fundamental risks suggests a high-probability bearish reversal, targeting a decline first to 87.284 and then towards 85.549. Traders should monitor for a confirmed break below the immediate support (e.g., a 4-hour close below 87.600) for entry and manage risk diligently by respecting the key invalidation level at 88.500. The reaction at the 85.549 target will be crucial for determining if this is a deep correction or the start of a larger trend change.
Chart Source: TradingView
Disclaimer: This analysis is for informational and educational purposes only and does not constitute financial advice or a recommendation to buy or sell any security. Forex trading involves high leverage and significant risk, including the possible loss of your entire investment. Always conduct your own research (DYOR) and consider seeking advice from an independent financial professional before making any trading decisions.
Suggested Ad Placements
For optimal user experience and ad revenue, place your ads in the following four locations within the article:
- After the “Executive Summary” (H2): The reader has just absorbed the core bearish reversal thesis. An ad here captures their full attention before they dive into the detailed technical rationale for the decline.
- In the middle of the “Technical Target(s) and Rationale” (H2) section, right after explaining the Initial Target. This creates a natural pause after the first profit-taking level is defined, making it an ideal moment for an ad before discussing the primary, deeper target.
- Immediately after the “Risk Management Considerations” (H2) section. This is a critical point where the trader is evaluating the trade’s risk-reward profile, especially important for a counter-trend play. An ad here fits the natural analytical flow.
- Right before the “Conclusion” (H2) section. This placement captures readers who have consumed the entire analysis but may not scroll past the final summary. It ensures the core content is delivered first while maximizing ad visibility.


