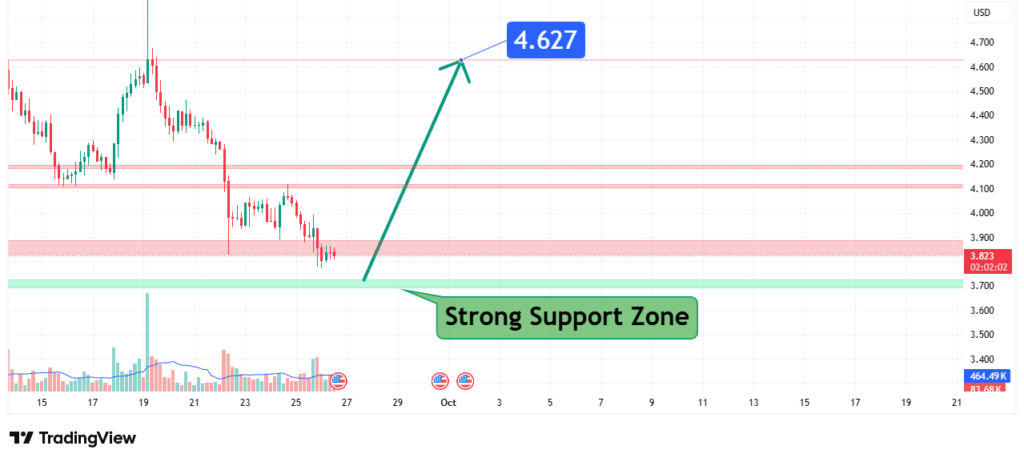
Polkadot (DOT) Price Analysis Bullish Breakout Imminent, Targeting $4.627
Polkadot’s (DOT) price has found a firm footing after a recent pullback, establishing a strong support zone around the $3.82 level. This consolidation above a critical support area suggests a bullish bias is forming. Our analysis projects a significant move towards a primary target of $4.627. This prediction is based on a confluence of technical factors, primarily the strength of the current support zone and the potential for a bullish reversal pattern to complete.
Current Market Structure and Price Action
The broader market structure for DOT has been corrective but is now showing signs of stabilization. The price action is currently characterized by a compression near a significant support level, indicating a balance between buyers and sellers. The ability of the price to hold above the $3.823 level, despite several tests, points to accumulating buying pressure. This low-volatility compression often precedes a strong directional move, and the evidence leans towards an upward breakout.
Identification of the Key Support Zone
The most critical technical element on the chart is the Strong Support Zone between approximately $3.70 and $3.82. The strength of this zone is derived from:
- Historical Significance: This level has acted as a major swing low and a consolidation area on multiple previous occasions, creating a robust base of buyer interest.
- Technical Confluence: The zone aligns with a key psychological level and has served as a launching pad for previous rallies, adding to its technical importance.
- Market Psychology: This area represents a point where sellers are exhausted, and buyers perceive value, leading to a potential shift in sentiment from bearish to bullish.
This multi-touch support confluence makes it a high-probability level for a bullish reaction.
Technical Target and Rationale
Our analysis identifies a clear primary price target.
Primary Target (PT1): $4.627
Rationale: This target is derived from the next significant resistance level visible on the higher timeframes. A breakout above the immediate consolidation range would likely propel the price towards this zone, which has previously acted as both support and resistance. Achieving this target would represent a gain of approximately 21% from the current support level.

Prediction: We forecast that DOT will successfully hold the $3.82 support, gather bullish momentum, and initiate a wave towards our primary target at $4.627.
Risk Management Considerations
A professional strategy is defined by its risk management.
- Invalidation Level (Stop-Loss): The entire bullish thesis is invalidated if the price achieves a sustained daily close below the support zone, specifically below $3.70. This level represents a clear break of the market structure that justifies the prediction, indicating that selling pressure has overwhelmed the buyers.
- Position Sizing: Any positions taken should be sized so that a loss triggered at the $3.70 invalidation level represents a small, pre-defined percentage of your total capital (e.g., 1-2%).
Fundamental Backdrop
The technical setup is framed by the current fundamental landscape:
- Broader Crypto Market Sentiment: DOT’s price is heavily correlated with the overall health of the cryptocurrency market, particularly Bitcoin’s momentum. A bullish turn in the general market would significantly aid this prediction.
- Polkadot Ecosystem Development: Continued growth in the number of parachains, active developers, and projects building on the Polkadot network provides a strong fundamental underpinning for long-term value.
- On-Chain Metrics: Monitoring metrics like active addresses and staking activity can provide additional confirmation of network strength.
Conclusion
Polkadot (DOT) is at a technical inflection point, demonstrating resilience at a key historical support level. The weight of evidence suggests a bullish resolution, targeting a move to $4.627. Traders should monitor for a confirmed breakout above the immediate consolidation range with increasing volume. Risk must be managed diligently by respecting the key invalidation level at $3.70. The reaction at the $4.62 target zone will be crucial for determining the next major directional move.
Chart Source: TradingView
Disclaimer: This analysis is for informational and educational purposes only and does not constitute financial advice or a recommendation to buy or sell any security. All trading and investing involves significant risk, including the possible loss of your entire investment. Always conduct your own research (DYOR) and consider seeking advice from an independent financial professional before making any trading decisions.


