Top 5 Profitable Trading Strategies for Consistent Returns
Tired of erratic results and emotional decision-making in the markets? Learning how to implement structured, profitable trading strategies is the key to transforming your performance. This step-by-step guide will walk you through five time-tested methods, from trend following to mean reversion, giving you a clear, actionable path to more consistent returns.
For traders in the US, UK, and other developed markets, using these strategies can help you navigate volatile indices like the S&P 500 and FTSE 100 with greater confidence and discipline.
Summary Table
| Aspect | Detail |
|---|---|
| Goal | Learn and implement five distinct trading strategies to achieve more consistent profitability. |
| Skill Level | Beginner to Intermediate |
| Time Required | Varies by strategy; approximately 20+ hours to learn and backtest. |
| Tools Needed | Trading platform, charting software, and historical data access. |
| Key Takeaway | Consistency comes from discipline and a systematic process, not from predicting the market. |
Why a Systematic Trading Approach is Crucial for Consistency
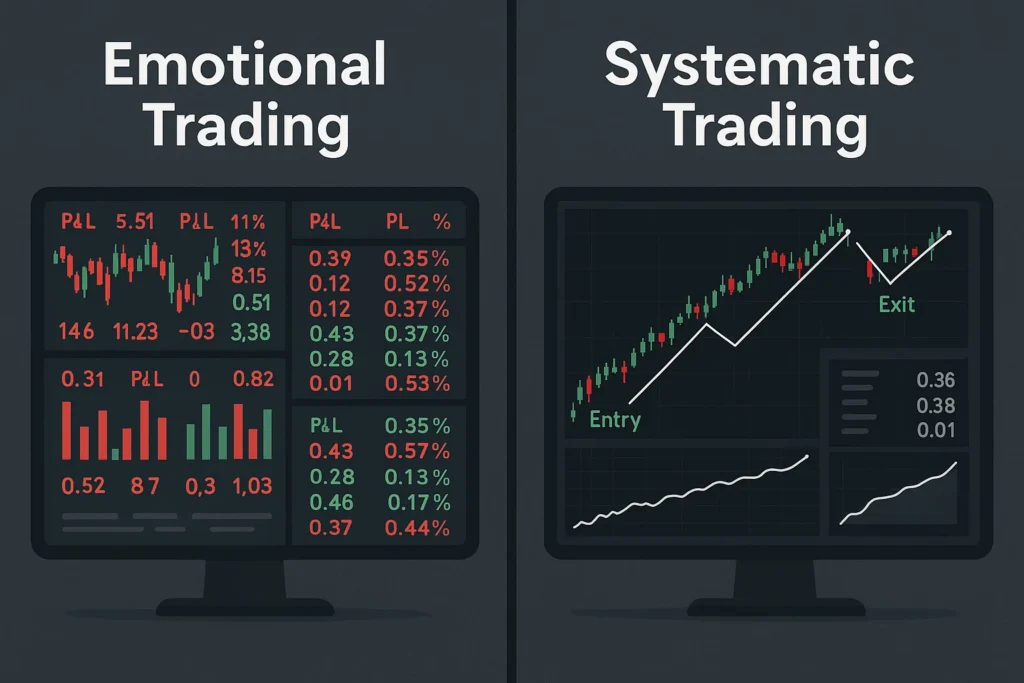
The problem for most struggling traders is a lack of a defined edge. They chase hot tips, react to news, and let fear and greed dictate their actions. This leads to inconsistent, and often negative, returns.
A systematic approach replaces emotion with logic. By following a pre-defined set of rules for entering, managing, and exiting trades, you solve the core problems of overtrading, revenge trading, and poor risk management.
When you master these strategies, you gain a framework for decision-making. You’ll know exactly what you’re looking for, when to act, and, just as importantly, when to stay out. This discipline is the foundation upon which long-term, consistent returns are built.
What You’ll Need Before You Start
Before diving into the strategies, ensure you have the right foundation and tools.
Knowledge Prerequisites:
- Basic understanding of candlestick charts and support/resistance.
- Fundamental knowledge of what a moving average and the Relative Strength Index (RSI) are.
Data Requirements:
- Access to real-time or delayed price data for your chosen markets (stocks, forex, crypto).
Tools & Platforms:
- A reliable charting platform. Thinkorswim (by TD Ameritrade/Schwab), TradingView, or MetaTrader are excellent choices.
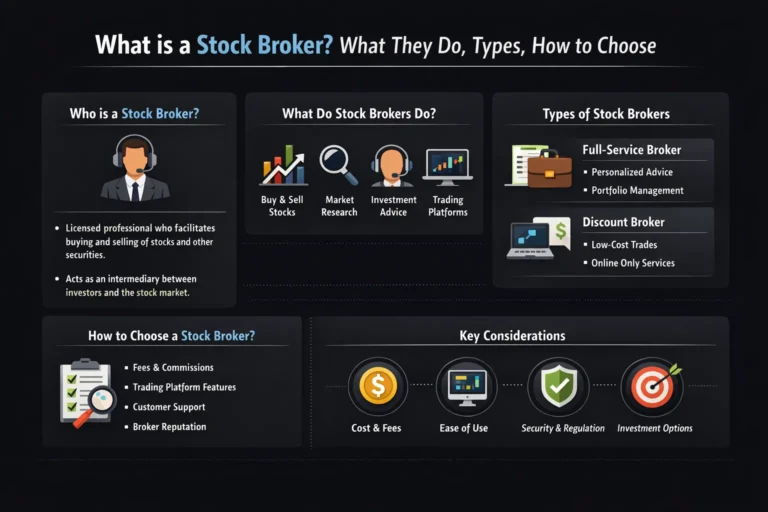
- A brokerage account to execute your trades.
To effectively implement these strategies, you’ll need a robust trading platform. Many of the best online brokers for active traders, like Interactive Brokers or TradeStation, offer advanced charting tools and direct market access that are essential for this type of analysis.
5 Profitable Trading Strategies for Consistent Returns
Here, we break down five powerful strategies. Treat this as a step-by-step guide to understanding each one’s mechanics.
Strategy 1: Trend Following with Moving Averages
This strategy operates on the simple but powerful principle that the trend is your friend. It aims to capture gains by riding a sustained price movement in one direction.
Step-by-Step Process:
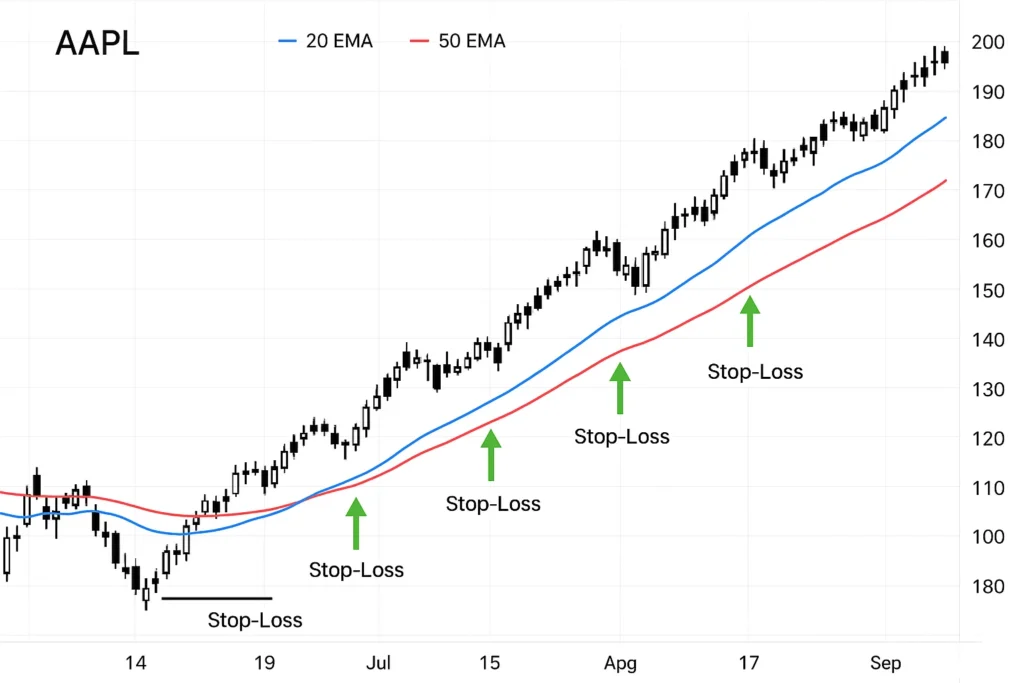
- Identify the Trend: Apply two Exponential Moving Averages (EMAs) to your chart—a fast one (e.g., 20-period) and a slow one (e.g., 50-period).
- Signal Entry: A buy signal is generated when the 20 EMA crosses above the 50 EMA. A sell signal occurs when the 20 EMA crosses below the 50 EMA.
- Manage Risk: Place a stop-loss order below the most recent swing low (for long trades) or above the most recent swing high (for short trades).
- Exit: Exit the trade when the moving averages cross in the opposite direction.
Pro Tip: This strategy works best in markets with strong, clear trends. It will generate false signals in ranging or choppy markets.
Common Mistake to Avoid: Adding to a losing position because you’re sure the trend will resume. Always respect your stop-loss.
Strategy 2: Momentum Trading with the RSI
Momentum traders buy assets that are moving strongly in one direction, expecting that the movement will continue.
Step-by-Step Process:
- Identify the Instrument: Look for assets that are already showing significant price movement and high volume.
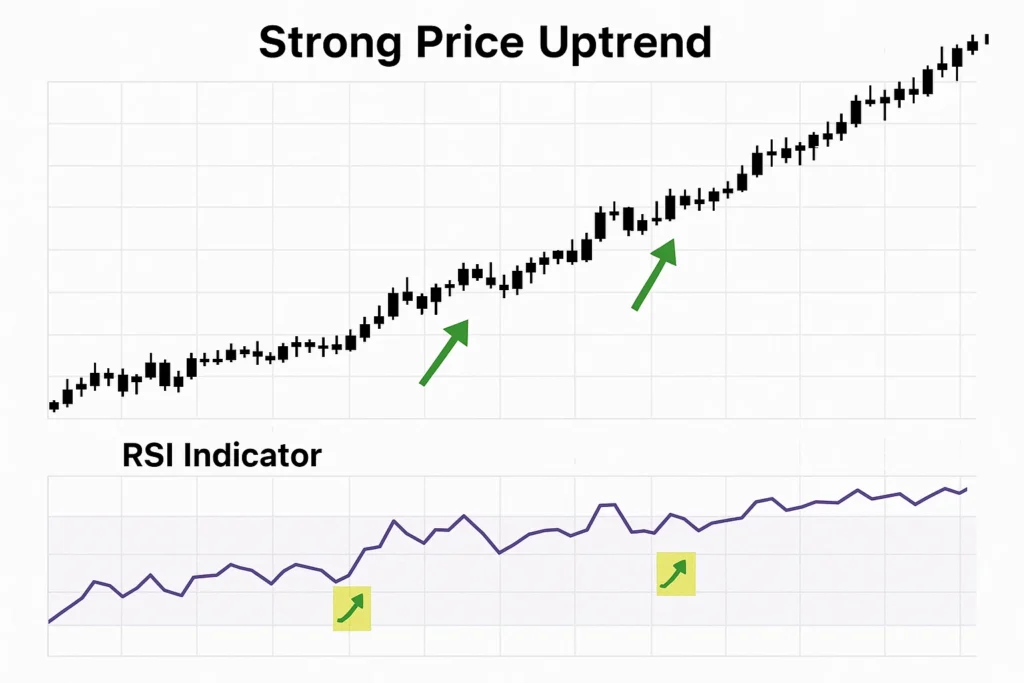
- Use the RSI Indicator: Apply the Relative Strength Index (RSI) with a 14-period setting.
- Signal Entry: A common entry is on a pullback. For an uptrend, buy when the RSI dips into the 40-50 range and then turns back up. Avoid buying when RSI is above 70 (overbought).
- Manage Risk: Place a stop-loss below the low of the pullback.
- Exit: Take profits when the RSI reaches or exceeds the 70 level, or when price shows signs of reversal like a bearish candlestick pattern.
Pro Tip: Combine RSI with a trending moving average filter. Only take long RSI signals when the price is above its 200-day MA, for example.
Common Mistake to Avoid: Fading the trend by selling just because RSI is overbought in a strong bull market. Overbought can remain overbought for a long time.
Strategy 3: Breakout Trading
Breakout traders aim to enter a trade right as the price breaks out of a well-defined consolidation or trading range, anticipating a strong directional move.
Step-by-Step Process:
- Identify a Consolidation Pattern: Look for patterns like Triangles, Rectangles, or Flags where the price is moving within a narrowing range.
- Draw Key Levels: Clearly mark the resistance level (top of the range) and support level (bottom of the range).
- Signal Entry: Enter a long trade when the price closes decisively above the resistance level on higher-than-average volume. Enter a short trade on a break below support.
- Manage Risk: Place a stop-loss order just inside the range, below the breakout level (for longs) or above it (for shorts).
- Exit: Price targets can be set by measuring the height of the consolidation pattern and projecting that distance from the breakout point.
Pro Tip: False breakouts are common. A close above the level (not just an intraday spike) and a surge in volume are key confirmations.
Common Mistake to Avoid: Chasing a breakout too far from the base. The best risk-reward entries are near the breakout point.
The Psychology of Pullbacks vs. Breakouts: This is a crucial psychological differentiator. Breakout trading is about anticipation and fear of missing out (FOMO) on a new move. Pullback trading (like in Strategy 2) is about patience and value, waiting for a discount within a trend. Understanding which mindset suits your personality can significantly improve your discipline.
Strategy 4: Mean Reversion with Bollinger Bands
This strategy is the opposite of momentum trading. It assumes that price will eventually revert to its mean (average) after an extreme move.
Step-by-Step Process:
- Apply the Indicator: Add Bollinger Bands to your chart (20-period simple moving average with 2 standard deviations).
- Identify an Extreme: Look for price to touch or break the outer Bollinger Band.
- Signal Entry: Do not enter immediately. Wait for price to close back inside the bands. For a long trade, this would be after price has touched the lower band and then produced a bullish candlestick (like a hammer) and closed back inside.
- Manage Risk: Place a stop-loss just beyond the recent extreme (the low for a long trade).
- Exit: Take profits when price moves back to the middle band (the 20-period SMA) or the opposite band.
Pro Tip: Mean reversion works best in ranging, non-trending markets. In a strong trend, this strategy will lead to many losses as price walks the band.
Common Mistake to Avoid: Catching a falling knife by buying the moment price hits the lower band in a ferocious downtrend.
Strategy 5: Simple Price Action (Support & Resistance)
This strategy strips away most indicators and focuses purely on the raw price data and the key levels it creates.
Step-by-Step Process:
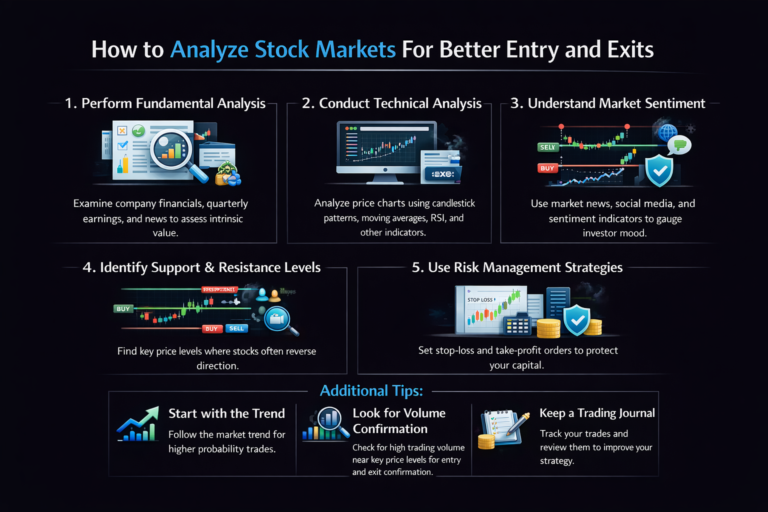
- Map Key Levels: Identify clear, tested levels of support (where buying pressure emerged) and resistance (where selling pressure emerged) on your chart.
- Signal Entry at Support: Look for a bullish price action signal (e.g., a bullish engulfing pattern, a pin bar) right at a support level. This is your buy signal.
- Signal Entry at Resistance: Look for a bearish price action signal at a resistance level for a sell/short signal.
- Manage Risk: Place your stop-loss just below the support level (for longs) or above the resistance level (for shorts).
- Exit: Take profits at the next level of resistance (for longs) or support (for shorts).
Pro Tip: The more times a level is tested and holds, the more significant it becomes. However, be wary of levels that have been tested too many times, as they are more likely to break.
Common Mistake to Avoid: Placing orders exactly at the support/resistance line. Smart money often runs stops just beyond these levels. Give your trade a little room.
How to Properly Backtest Any Strategy
Knowing a strategy is useless if you don’t know how to validate it. Backtesting is the process of applying your trading rules to historical data to see how it would have performed.
Step-by-Step Backtesting Process:
- Define Your Rules Precisely: Write down every detail of your strategy. Entry condition, exit condition, stop-loss placement, position sizing. Leave no room for interpretation.
- Choose Your Software: You can do this manually on a platform like TradingView by scrolling back in time, or use automated backtesting engines.
- Run the Test & Record Meticulously: Go through the data, trade by trade. For each trade, record: Entry Date, Entry Price, Exit Date, Exit Price, Profit/Loss, and any notes (e.g., slippage, news event).
- Analyze the Metrics: Don’t just look at net profit. Calculate:
- Win Rate: (Number of Winning Trades / Total Trades)
- Profit Factor: (Gross Profit / Gross Loss) – A value above 1.0 is profitable.
- Maximum Drawdown: The largest peak-to-trough decline in your equity curve. This is crucial for understanding your potential risk.
- Refine and Re-test (Carefully): If the results are poor, make a small adjustment to the rules and test again. Avoid overfitting – creating a strategy that works perfectly on past data but fails in the future.
How to Use These Strategies in Your Trading Plan
Knowing the strategies is one thing; integrating them into a coherent plan is another.
Scenario 1: The Trend-Follower’s Day. You identify the overall market trend using a higher timeframe (e.g., the daily chart). You then use a pullback strategy like the RSI method (Strategy 2) on a lower timeframe (e.g., the 1-hour chart) to find high-probability entries in the direction of the trend.
Scenario 2: The Range-Trader’s Day. If your analysis shows the market is choppy and without direction, you can switch to a mean reversion approach (Strategy 4) or focus purely on price action at support and resistance (Strategy 5).
Case Study: In Q2 2023, the S&P 500 began a strong uptrend. A trader using the multi-timeframe approach would have used the Trend-Following strategy (Strategy 1) on the daily chart to confirm the bullish bias. Then, on the 4-hour chart, they could have used the RSI pullback method (Strategy 2) to enter on dips, effectively riding the majority of the trend while managing risk on each entry.
Common Mistakes When Implementing Trading Strategies
Pitfall 1: Strategy Hopping. Jumping from one strategy to another after a few losing trades.
Solution: Choose one primary strategy and commit to backtesting and trading it for at least 3 months. Give it time to work through different market cycles.
Pitfall 2: Improper Position Sizing. Betting too much on any single trade.
Solution: Never risk more than 1-2% of your total trading capital on a single trade. This is non-negotiable for survival.
Pitfall 3: Ignoring Market Context. Using a mean reversion strategy in a strong trend, or a breakout strategy in a choppy range.
Solution: Always start your analysis by determining the broader market context (Trending or Ranging?) on a higher timeframe before applying your strategy.
The Engine of Survival: A Primer on Risk Management
A mediocre strategy with excellent risk management will always outperform an excellent strategy with poor risk management. This is the most significant measure of your strategy.
The 1% Rule: Never risk more than 1% of your total account equity on a single trade. If you have a $10,000 account, your maximum loss per trade is $100.
How to Calculate Your Position Size:
Use this formula: Position Size = (Account Size * Risk per Trade %) / (Entry Price – Stop Loss Price)
Example: You have a $10,000 account and risk 1% ($100). You want to buy Stock ABC at $50, with a stop-loss at $48.
- Position Size = ($10,000 * 0.01) / ($50 – $48) = $100 / $2 = 50 shares.
- Buying 50 shares at $50 costs $2,500. If stopped out at $48, your loss is $2 per share, totaling $100 (1% of your account).
The Reward-to-Risk Ratio: Before entering any trade, measure your potential profit (from entry to your profit target) against your potential loss (from entry to your stop-loss). Aim for a ratio of at least 1:1, but 1.5:1 or 2:1 is far better. This means if you’re risking $100, your potential profit should be $150-$200.
- Removes Emotion: Your decisions are based on rules, not fear or greed.
- Backtestable: You can objectively test your strategy on historical data to see if it has a positive edge.
- Provides Consistency: A clear process leads to consistent execution, which is the gateway to consistent returns.
- Allows for Improvement: It’s easier to identify flaws in a system than flaws in your own vague feelings.
- Requires Discipline: The hardest part is following your own rules, especially during a losing streak.
- Can Experience Drawdowns: No strategy wins 100% of the time; all will go through periods of losses.
- Market Dynamics Change: A strategy that worked brilliantly last year may fail this year if market volatility or structure changes.
- Analysis Paralysis: Having too many strategies can be as bad as having none.
Taking Your Trading to the Next Level
Once you are comfortable with the basics of these strategies, you can begin to refine your edge.
Strategy Fusion: The most powerful systems often combine elements from multiple strategies. For example, you could use a moving average crossover to define your trend (Strategy 1) and then only take RSI pullback signals (Strategy 2) that are in the direction of that trend.
Quantitative Backtesting: Move beyond manual backtesting. Use platforms like QuantConnect or MetaTrader’s Strategy Tester to code your strategy logic and test it over decades of data across multiple instruments. This provides robust statistical proof of your strategy’s edge.
Systematic Trading vs Discretionary Trading vs Buy & Hold Investing
| Feature | Systematic Trading | Discretionary Trading | Buy & Hold Investing |
|---|---|---|---|
| Basis | Strict, pre-defined rules. | Trader’s intuition & experience. | Long-term fundamentals. |
| Time Horizon | Short to Medium-term. | Short to Medium-term. | Long-term (Years+). |
| Emotion | Aims to eliminate it. | Highly susceptible to it. | Requires emotional fortitude. |
| Activity Level | High. | High. | Low. |
| Primary Goal | Consistent Alpha. | Outsize returns from insight. | Long-term wealth building. |
Conclusion
You now possess a toolkit of five powerful trading strategies used by professionals to pursue consistent returns. The path forward is not about prediction, but about process. Remember the key steps: choose one strategy, backtest it thoroughly, practice with discipline, and manage your risk above all else.
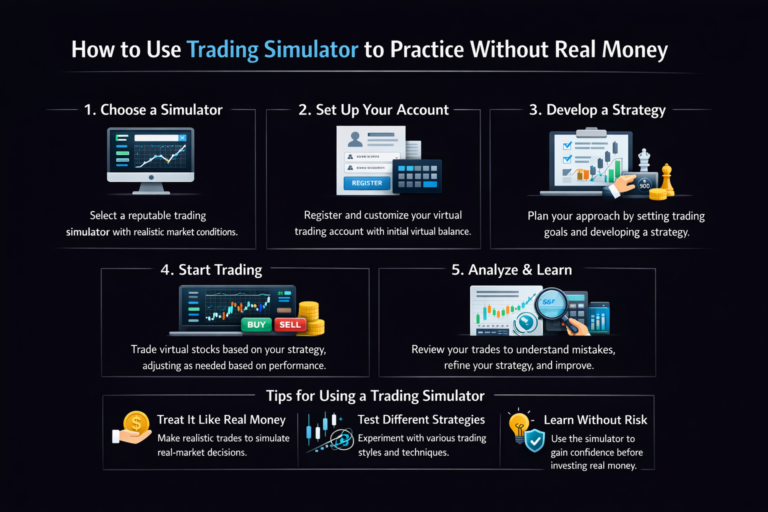
To make your strategy development and backtesting effortless, download our free Trading Strategy Checklist & Journal PDF. And if you’re looking for a platform to practice these strategies risk-free, check out our review of the best demo trading accounts for beginners.
