Silver's Meteoric Ascent Technical Analysis Points to a Target of $45.19
The long-term chart for Silver (XAG/USD) depicts a financial asset in the midst of a historic and powerful bullish transformation. After a prolonged period of consolidation and base-building, the price has decisively broken out from its previous trading range, entering a phase of parabolic advancement. The current price action shows silver trading at levels not seen in years, having clearly overcome significant psychological and technical barriers. This decisive move suggests a fundamental shift in market dynamics, where demand is overwhelmingly outstripping supply. This analysis will break down the technical factors fueling this rally and project a clear, measurable target for its next major phase.
Analyzing the Momentum and Chart Structure
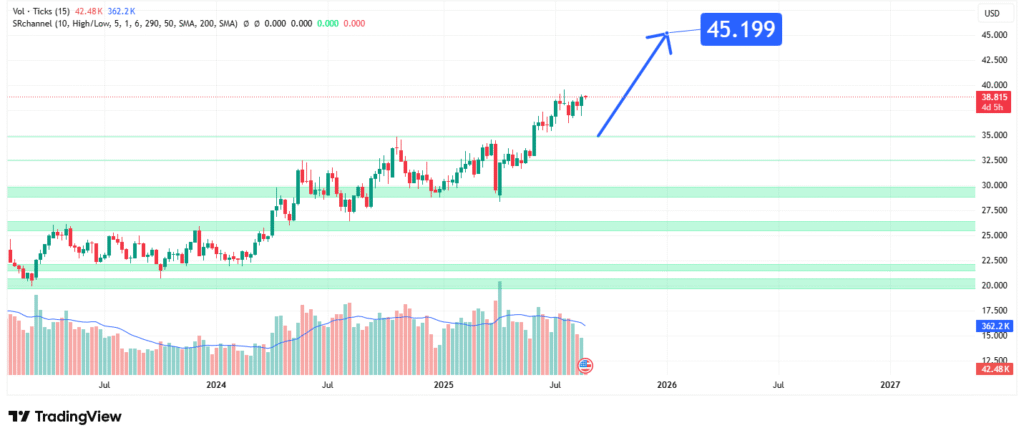
The most striking feature of the chart is the sheer verticality of the recent price climb. This type of movement is characteristic of a market experiencing a powerful impulse wave, often driven by a confluence of fundamental drivers—such as monetary policy expectations, industrial demand, and its role as a monetary metal—all aligning positively. The price has surged from a major support base near $18.153, representing a gain of over 43.95% to current levels. This move has likely cleared a multi-year resistance zone, converting it into a new support foundation. The absence of any significant pullbacks on this timeframe indicates exceptionally strong buying pressure, with each minor dip being aggressively purchased. This structure is classically bullish and suggests that the trend has strong underlying momentum with little immediate overhead resistance.
Price Projection and the $45.19 Target
In technical analysis, after a decisive breakout from a long-term base, the initial major resistance level often becomes the primary upside target. The chart clearly indicates that the price is advancing rapidly toward the $45.000 psychological barrier. The specified target of $45.199 USD is a precise and logical objective for this rally. This level likely represents a key technical resistance point, potentially a previous major high or a Fibonacci extension level derived from the prior consolidation range. Reaching this target would signify a full realization of the momentum generated by the initial breakout. A clean breach above this level would be an extraordinarily bullish signal, potentially opening the door to even higher targets, perhaps toward the $50.00 region. However, $45.19 stands as the critical benchmark that must be achieved first.
Risk Management: Navigating Volatility at Highs
While the trend is unequivocally bullish, trading at new multi-year highs requires prudent risk management. Parabolic advances can be susceptible to sharp, volatile corrections. The key for traders is to identify the new support levels created by the breakout. The first major support likely resides near the $35.000 level, which was the previous resistance ceiling. A deeper pullback could extend toward the $30.000 – $32.500 zone. The bullish thesis would only be materially damaged by a sustained break below this deeper support region, which would indicate a failure of the breakout. Until then, the path of least resistance remains firmly to the upside, with any retracement viewed as a potential buying opportunity within the larger bullish cycle.
Conclusion: Riding the Wave to Higher Targets
In conclusion, the technical outlook for Silver is exceptionally bullish. The asset has successfully broken out of a multi-year base with tremendous momentum, signaling a new era of price discovery. The chart structure supports a continued advance toward the primary target of $45.199 per ounce. Traders and investors should consider strategies that allow them to participate in this uptrend while respecting the potential for increased volatility. Adopting a “buy on dips” approach near the $35.000 support level or utilizing prudent position sizing for new entries at current levels are viable strategies. The market has spoken with clarity, and the message is one of strength and higher prices.
Chart Source: TradingView
Disclaimer: This analysis is based on technical patterns and is for informational purposes only. It is not financial advice. Trading commodities, especially leveraged instruments, involves extreme risk and is not suitable for all investors. Always conduct your own research and manage your risk accordingly.
How did this post make you feel?
Thanks for your reaction!
