Solana Primed for $199 Retest! Key Signals Point to Imminent Breakout
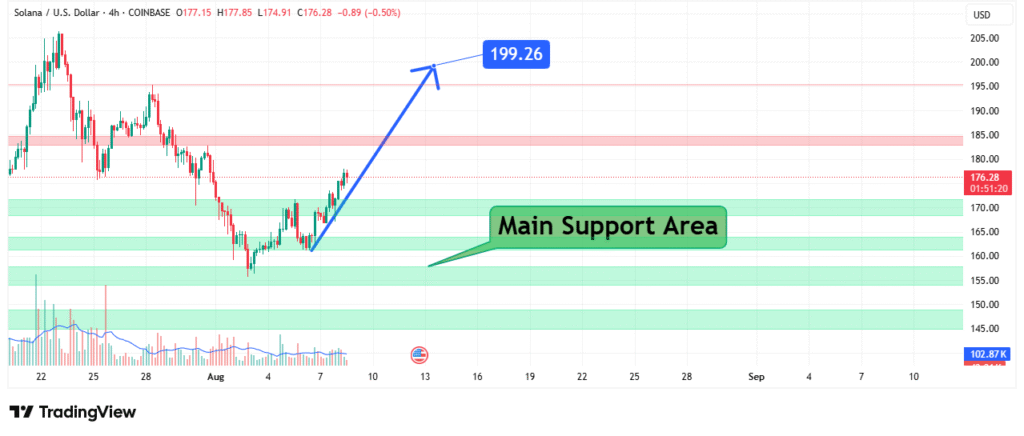
The provided 4-hour Solana (SOL/USD) chart from TradingView reveals a cryptocurrency currently testing key support levels after a recent pullback. Trading at $176.28 at the time of analysis, SOL has declined 0.90% from its previous close, with the session’s high at $177.85 and low at $174.91. This breakdown explores crucial price levels, market structure, and potential scenarios for SOL in the near term.
Current Price Action and Short-Term Trend
Solana’s recent price movement shows a bearish short-term bias, with the cryptocurrency struggling to hold above the $177.15 opening price. The 4-hour candle closed at $176.28, slightly above the day’s low of $174.91, indicating minor buying interest at lower levels. However, the inability to reclaim $180.00 suggests weakening momentum.
The broader trend reveals a descending structure, with SOL facing consistent resistance near $185–$190, while support has formed around $170–$175. A decisive break below this zone could trigger further downside, whereas a rebound may signal consolidation before another upward attempt.
Key Support and Resistance Levels
Critical Support Zones:
- Immediate Support: $174.91–$170.00
- This area has previously acted as a buying zone; losing it could accelerate selling pressure.
- Strong Support: $165.00–$160.00
- A deeper retracement may find demand near this level, aligning with past accumulation zones.
Major Resistance Levels:
- First Hurdle: $180.00
- A recovery above this level could signal short-term bullish momentum.
- Upper Resistance: $185.00–$190.00
- Breaking this range is essential for SOL to regain its bullish structure.
- All-Time High Retest: $199.26
- A sustained rally beyond $190 could target the recent peak.
Volume and Market Sentiment
While volume data isn’t explicitly shown, the gradual decline in price suggests moderate selling pressure without panic exits. The lack of strong bullish reversal candles indicates that buyers remain cautious.
- Bullish Case: If SOL holds $170 and rebounds with increasing volume, a retest of $185 becomes likely.
- Bearish Case: A breakdown below $170 could lead to a swift drop toward $160, especially if Bitcoin and the broader crypto market weaken.
Future Outlook and Trading Strategies
Bullish Scenario:
- Confirmation Signal: A 4-hour close above $180.00 with rising volume.
- Price Target: Initial move toward $185, followed by $190–$199.26 if momentum sustains.
Bearish Scenario:
- Breakdown Signal: A sustained drop below $170.00 with strong selling volume.
- Downside Target: $165–$160, potentially lower if market sentiment worsens.
Key Factors to Watch:
- Bitcoin’s Movement: SOL often correlates with BTC—watch for macro trends.
- DeFi & NFT Activity: Increased Solana network usage could fuel demand.
- Exchange Flows: Large SOL movements on exchanges may signal accumulation/distribution.
Conclusion
Solana is at a critical juncture, balancing between $170 support and $180 resistance. Traders should wait for a confirmed breakout or breakdown before committing to positions. A rebound above $180 could reignite bullish momentum, while a drop below $170 may lead to extended downside toward $160. Given the current market uncertainty, risk management remains essential—watch for volume shifts and broader crypto trends for directional cues.
