Solana (SOL) Price Analysis Bearish Breakdown Targets $175
Solana’s price has faced a strong rejection after testing the $205 resistance area. This price action suggests a bearish bias is forming as buyers fail to sustain momentum. Our analysis projects a decline towards a primary target of $175, a key historical support level. This prediction is based on a confluence of technical factors, including a clear “Strong Resistance” zone identified on higher timeframes and signs of buyer exhaustion at a critical psychological level.
Current Market Structure and Price Action
The broader market structure for SOL remains bullish on higher timeframes, characterized by a series of higher highs and higher lows since the significant drop in late 2022. However, on the shorter-term daily and 4-hour charts, the structure shows signs of stalling. The price is currently interacting with a dense and significant resistance cluster between $192 and $205. Recent price action has shown long upper wicks and indecision candles near this zone, indicating that sellers are actively defending this level and a potential breakdown towards support may be imminent.
Identification of the Key Resistance Zone
The most critical technical element is the Strong Resistance Zone between $192 and $205, with a clear focal point at $205. The strength of this zone is derived from:
- Historical Significance: This level has acted as a major swing high and consolidation area on multiple occasions throughout 2024. Each touch has resulted in a notable price rejection.
- Technical Confluence: The provided analysis image explicitly labels this area as “Strong Resistance,” a sentiment echoed by many market participants. It also aligns with the key psychological round number of $200.
- Market Psychology: This area represents a point where profit-taking from recent buyers and new selling pressure from participants who missed the initial rally converge, creating a supply overload.
This multi-layered confluence makes it a high-probability zone for a bearish reaction.
Technical Target(s) and Rationale
Our analysis identifies the following price target:
- Primary Target (PT1): $175
Rationale: This level represents a previous major swing low and a strong historical support zone. It is a prominent level on the chart where buying pressure has previously emerged. A drop to this level would represent a natural and logical test of support following a rejection from the $205 resistance.
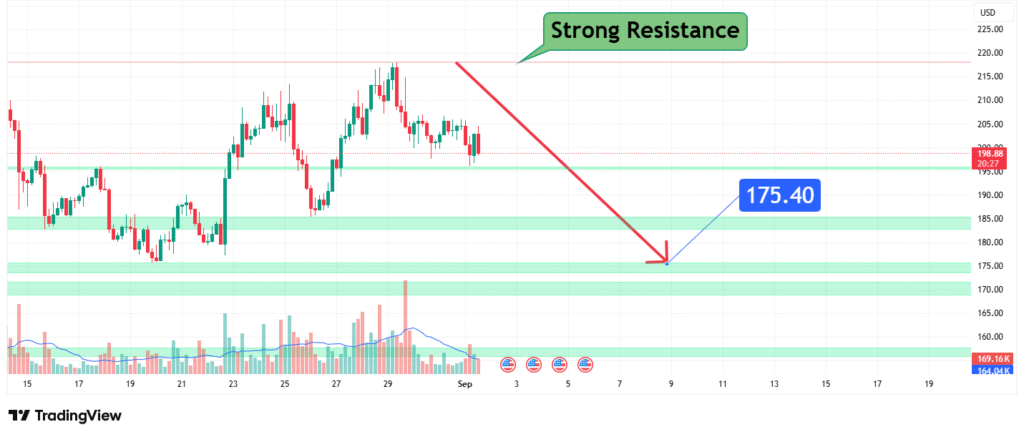
Prediction: We forecast that the price will be rejected from the current resistance zone and move down towards our PT1 at $175. A sustained break below this support could open the path towards $165, but our core analysis focuses on the $175 target as the next key level.
Risk Management Considerations
A professional strategy is defined by its risk management.
- Invalidation Level (Stop-Loss): The entire bearish thesis is invalidated if the price achieves a sustained daily close above $205. This level represents a clear break of the identified strong resistance and would signal a continuation of the bullish momentum, likely targeting the next resistance near $225. A stop-loss order should be placed just above this level (e.g., $207-$210).
- Position Sizing: Any short positions or hedging strategies taken based on this analysis should be sized so that a loss triggered at the invalidation level above $207 represents a small, pre-defined percentage of your total capital (e.g., 1-2%).
Fundamental Backdrop (Context)
The technical setup is framed by the current fundamental landscape:
- Broader Crypto Market Sentiment: SOL’s price is highly correlated with Bitcoin (BTC) and Ethereum (ETH). Any significant bearish or bullish moves in these major assets will heavily influence SOL’s ability to reach its target.
- Network Performance and Adoption: While the network has seen improved stability and growth in its NFT and DeFi ecosystems, positive fundamentals are currently being overshadowed by technical selling pressure at this key level.
- Macroeconomic Factors: Upcoming interest rate decisions and macroeconomic data can inject volatility into the entire crypto market, impacting risk assets like Solana.
Conclusion
Solana is at a technical inflection point, facing a formidable wall of resistance. The weight of evidence from the price action suggests a bearish resolution is likely, targeting a move down to the $175 support zone. Traders should monitor for a confirmed breakdown below the $192-$190 level as a signal that the move is commencing. Risk must be managed diligently by respecting the key invalidation level above $205. The reaction of buyers at the $175 target will be crucial for determining whether the longer-term bullish structure remains intact.
Chart Source: TradingView
Disclaimer: This analysis is for informational and educational purposes only and does not constitute financial advice or a recommendation to buy or sell any security. All trading and investing involves significant risk, including the possible loss of your entire investment. Always conduct your own research (DYOR) and consider seeking advice from an independent financial professional before making any trading decisions.
