Solana (SOL) Price Analysis Bearish Breakdown Targets $199
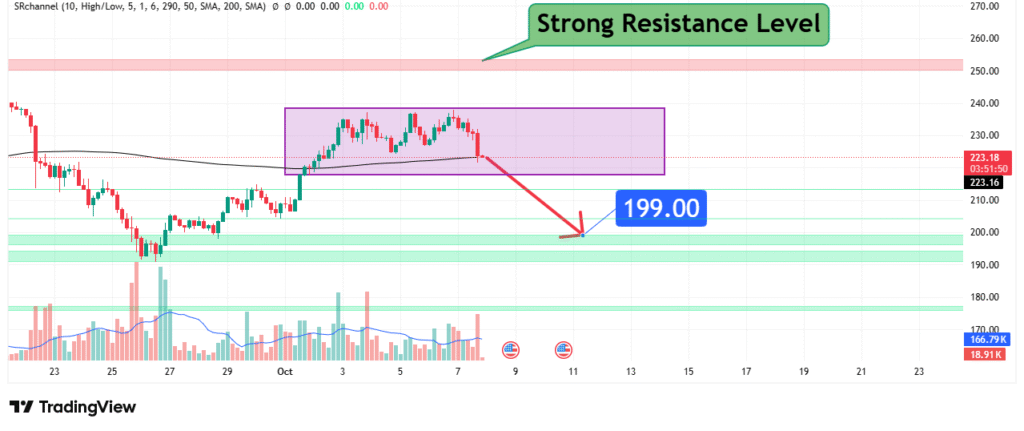
Solana’s price has been consolidating in a narrowing range but now shows clear signs of a bearish breakdown. The price has breached key support and is now testing a weaker zone around $223. Our analysis projects a further decline towards a primary target of $199. This prediction is based on a confluence of technical factors, including a “Strong Resistance” level identified on the chart, a breakdown from a consolidation pattern, and the bearish momentum indicated by the price structure.
Current Market Structure and Price Action
The market structure for SOL has shifted from neutral to bearish. The price was previously contained within a descending range, finding temporary support near the $240-$250 area. However, the recent breakdown below this level and the subsequent drop to the $223 support zone confirm a bearish breakout. The price action is now characterized by lower highs and a break of a significant lower low, indicating that sellers are in control. The current bounce at $223 appears weak, suggesting it is more likely a pause before further downside.
Identification of the Key Resistance Zone
The most critical technical element is the Strong Resistance Zone between $240 and $250, as explicitly labeled on the chart. The strength of this zone is derived from:
- Historical Significance: This level acted as a floor for price throughout late September and early October. Once broken, former support transforms into strong resistance.
- Technical Confluence: The zone aligns with the descending trendline of the recent price channel and a cluster of previous closes, adding to its technical significance.
- Market Psychology: This area now represents a point where previous buyers (who are now at a loss) would be looking to exit their positions, creating selling pressure.
This confluence makes it a high-probability level for any bullish rallies to be rejected.
Technical Target(s) and Rationale
Our analysis identifies the following price target:
- Primary Target (PT1): $199.00
- Rationale: This level is a major psychological round number and a strong historical support level, as evidenced by its clear labeling on the provided chart. It represents the most significant support level below the current price. A measured move projection from the breakdown point of the $240-$250 range also points towards this target.

Prediction: We forecast that the price will fail to reclaim the $240 resistance and will break below the current $223 support, accelerating the move towards our primary target at $199. A decisive break below $199 would open the path towards the next significant support near $183.
Risk Management Considerations
A professional strategy is defined by its risk management.
- Invalidation Level (Stop-Loss): The entire bearish thesis is invalidated if the price achieves a daily close above $250. This level represents a clear break back into the prior consolidation range and would negate the bearish breakdown structure. A more conservative invalidation level can be set just above the strong resistance zone, around $255.
- Position Sizing: Any short positions taken should be sized so that a loss triggered at the invalidation level represents a small, pre-defined percentage of your total capital (e.g., 1-2%).
Fundamental Backdrop
The technical setup is framed by the current fundamental landscape:
- Macroeconomic Pressure: Broader cryptocurrency markets remain sensitive to macroeconomic indicators and Federal Reserve policy, which can create headwinds for speculative assets like Solana.
- Network Performance: While the Solana network has seen improved stability, any negative news regarding outages or congestion could exacerbate the selling pressure.
- Overall Crypto Sentiment: The market sentiment remains cautious. A failure of Bitcoin to hold key levels could trigger a broader sell-off, pulling Solana lower towards our target.
Conclusion
Solana is at a technical inflection point following a clear bearish breakdown. The weight of evidence, including the strong resistance at $240-$250 and the break of structure, suggests a further decline is likely, targeting a move to $199. Traders should monitor for a confirmed break below the $223 support and manage risk diligently by respecting the key invalidation level above $250. The reaction at the $199 target zone will be crucial for determining whether the downtrend will continue or if a significant reversal is at hand.
Chart Source: TradingView
Disclaimer: This analysis is for informational and educational purposes only and does not constitute financial advice or a recommendation to buy or sell any security. All trading and investing involves significant risk, including the possible loss of your entire investment. Always conduct your own research (DYOR) and consider seeking advice from an independent financial professional before making any trading decisions.


