S&P 500 at Critical Juncture Will 6,540 Support Hold
The S&P 500 is navigating a pivotal technical juncture as it descends into a dense and historically significant Strong Support Zone around the 6,540 level. This region is not a single line but a broad band of converging technical factors, making it a crucial battleground between bulls and bears. The market’s reaction to this zone will likely dictate the next major directional move for the index.
This analysis will deconstruct the components of this key support area, evaluate the potential outcomes, and outline the implications of a successful defense versus a decisive breakdown.
Deconstructing the Strong Support Zone
The term “Strong Support Zone” indicates a price band where multiple technical analysis elements align, creating a high-probability area for a potential reversal or, at minimum, a significant pause in the downtrend. The zone centered around 6,540 is significant for several likely reasons:
- Previous Resistance Turned Support: A fundamental tenet of technical analysis is that former resistance becomes new support. The 6,540 level likely represented a significant ceiling in the past. Once price broke above it, that level flipped into a support floor. A retest of this level is a classic technical event.
- Confluence with a Key Fibonacci Retracement: This zone likely coincides with a major Fibonacci retracement level (e.g., the 61.8% or 50% retracement) of a prior significant upward wave. These levels are watched closely by institutional traders and algorithms, creating natural clusters of buy orders.
- Long-Term Moving Average Support: A major long-term moving average, such as the 200-day Exponential Moving Average (EMA), may be residing within this zone. These averages often act as dynamic support in bull markets and are fiercely defended by buyers.
- Psychological Significance: The 6,500 level is a major psychological round number. The area just above it (~6,540) often acts as a defensive line for bulls aiming to prevent a slide into a new, lower trading range.
The convergence of these factors makes the 6,540 – 6,520 area a formidable support cluster where a bounce is statistically probable.
The Bullish Scenario: Defense and Reversal
For the bullish case to prevail, buyers must aggressively defend this zone. Traders should monitor for specific confirming signals:
- Bullish Price Action Rejection: The most compelling evidence would be the formation of bullish reversal candlestick patterns. A hammer, a bullish engulfing pattern, or a morning star formation at this support level would indicate strong buying pressure and a likely bounce.
- Positive Momentum Divergence: If the price makes a new low near or within the support zone, but momentum oscillators like the Relative Strength Index (RSI) or the MACD form a higher low, it creates a bullish divergence. This signals that selling momentum is waning even as price drops, often preceding a powerful reversal.
- Volume Surge on the Bounce: A sharp increase in buying volume on the first up-day from the support zone would confirm that institutional players are stepping in, lending credibility to the bounce.
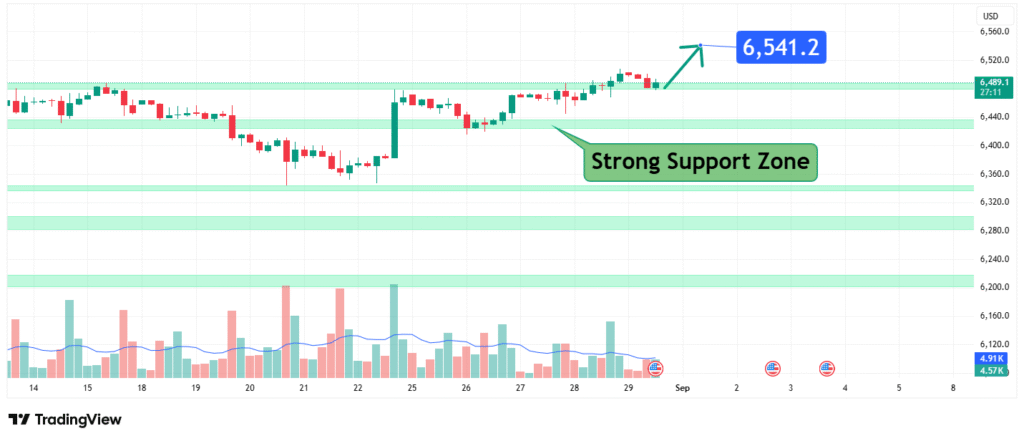
Target following a successful bounce: A hold above this support opens the path for a relief rally toward recent resistance levels. The initial upside targets would likely be the 6,720 and 6,800 levels, which have acted as local tops.
The Bearish Scenario: Breakdown and Acceleration
While the support zone is strong, it is not impervious. A decisive breakdown would be a severely bearish signal, indicating that underlying selling pressure has overwhelmed all major technical defenses.
- Breakdown Confirmation: A breakdown is confirmed by a sustained daily close below the core of the support zone, particularly below 6,500. This should be accompanied by high volume, indicating conviction in the move lower.
- Failed Retest: Often, after an initial break, price will snap back to retest the broken support level (now turned resistance) from below. A rejection from the ~6,540 level on such a retest would be a final confirmation of the breakdown’s validity.
Target following a breakdown: A failure to hold 6,540 would signal a continuation of the downtrend. The next major support levels below are not clearly defined in the provided data, but based on typical market structure, they could be found near 6,400, 6,300, and 6,200. A break of this key zone could trigger an acceleration toward these lower targets.
Trading Implications and Risk Management
This setup presents a clear “if-then” scenario for traders.
- Bullish Bias (Longs): Aggressive bulls may look for long entries on confirmed bullish reversal patterns within the support zone (e.g., 6,540 – 6,520). A stop-loss must be placed below 6,500 to protect against a false signal and breakdown. The initial profit target would be 6,720.
- Bearish Bias (Shorts): Bears would wait for a confirmed breakdown with a daily close below 6,500. A short entry could be initiated on a retest of the 6,540 resistance level following the break. A stop-loss would be placed above 6,560. The profit target would be projected toward lower supports (6,400).
Conclusion: A Line in the Sand at 6,540
The 6,540 level represents a critical “line in the sand” for the S&P 500. The confluence of technical factors in this zone makes it a high-probability area for a market reaction.
- A strong bounce confirms the zone’s strength and suggests a tradable relief rally is underway.
- A decisive breakdown below 6,500 would be a significant bearish event, indicating a new phase of selling with substantially lower targets.
Traders should not preempt this move but instead wait for price action to confirm the market’s decision. Managing risk with precise stop-loss orders on either side of this zone is paramount.
Disclaimer: This article is for informational and educational purposes only and is based on technical analysis. It does not constitute financial advice or a recommendation to buy or sell any security. The price predictions are the author’s personal perspective. Trading stocks and indices involves substantial risk of loss and is not suitable for every investor. Always conduct your own research and consider seeking advice from a qualified financial advisor before making any investment decisions. Past performance is not indicative of future results.
How did this post make you feel?
Thanks for your reaction!
