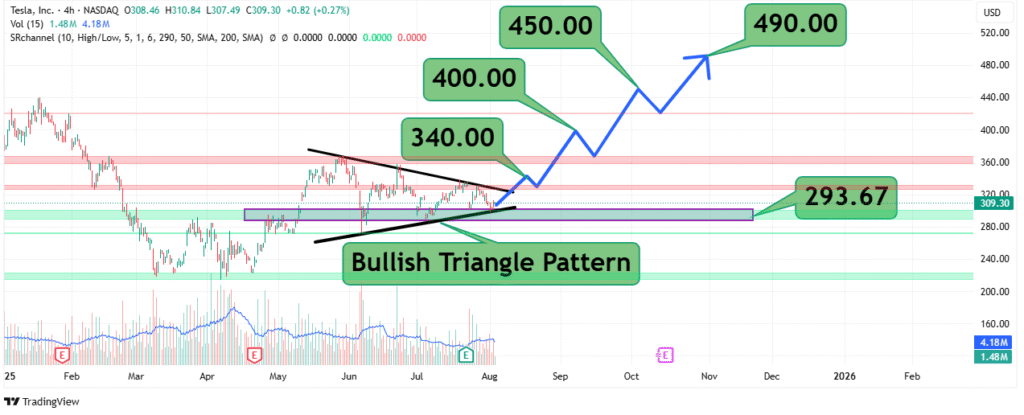
Tesla Price Analysis - A Potential Breakout Signal
Tesla’s stock (TSLA) is showing signs of consolidation with a bullish triangle pattern forming on the 4-hour chart. As of the latest close, the stock traded at $309.30, up 0.27%, with a session range of $307.49–$310.84. Volume remains moderate at 1.48M, below the 15-period average of 4.18M, suggesting cautious trading before a potential breakout.
Key Technical Observations
1. Price Structure & Pattern
- Bullish Symmetrical Triangle: The stock is compressing between converging trendlines, indicating a potential breakout.
- Upper Resistance: ~$320.00 (declining trendline resistance).
- Lower Support: ~$293.67 (rising trendline support).
- A breakout above $320.00 could trigger a rally toward $340.00–$360.00.
- A breakdown below $293.67 may lead to a retest of $280.00.
2. Moving Averages (Trend Confirmation)
- 50 SMA (Short-Term): Currently near $300.00, acting as dynamic support.
- 200 SMA (Long-Term): At $290.00, a critical level for bulls to defend.
- Price above both SMAs suggests an overall bullish bias.
3. Volume & Momentum
- RSI (14): Neutral (~50–60), no extreme overbought/oversold conditions.
- MACD (12,26,9): Histogram is flat, signaling consolidation before a potential move.
Trading Strategies

Scenario 1: Bullish Breakout
- Trigger: A decisive 4-hour close above $320.00 with rising volume.
- Targets:
- $340.00 (Initial resistance).
- $360.00–$400.00 (Extended upside if momentum holds).
- Stop-Loss: Below $300.00 (50 SMA support).
Scenario 2: Bearish Breakdown
- Trigger: A drop below $293.67 (triangle support) with increasing selling volume.
- Targets:
- $280.00 (Next key support).
- $240.00 (Long-term demand zone).
- Stop-Loss: Above $310.00 (recent swing high).
Key Levels to Watch
| Resistance | Support |
|---|---|
| $320.00 (Breakout level) | $300.00 (50 SMA) |
| $340.00 | $293.67 (Triangle support) |
| $360.00 | $280.00 |
| $400.00 | $240.00 |
Indicator-Based Confirmation
- Volume Surge: Needed to validate breakout/breakdown.
- MACD Crossover: Bullish if MACD line crosses above signal line.
- RSI > 60: Would confirm strengthening bullish momentum.
Final Verdict
Tesla’s stock is at a pivotal juncture, with the bullish triangle pattern hinting at an impending breakout. Traders should wait for a confirmed move above $320.00 or below $293.67 before taking positions.
Trade with discipline and strict risk management! 🚀


