Top 10 Liquid Stocks of 2026 You Should Know before Investing
A liquid stock is one that can be easily bought or sold in the market without significantly affecting its price. It is the lifeblood of efficient markets, providing the flexibility and speed that traders and investors in the US, UK, Canada, and Australia rely on for executing strategies on major exchanges like the NYSE, NASDAQ, and LSE. Understanding liquidity is fundamental to managing risk and transaction costs.
Summary Table
| Aspect | Detail |
|---|---|
| Definition | A stock that can be quickly bought or sold in substantial volume with minimal impact on its market price. |
| Also Known As | High-Liquidity Stock, Marketable Security |
| Main Used In | Stock Trading, Portfolio Management, Day Trading, Swing Trading |
| Key Takeaway | Liquidity minimizes your trading costs and slippage, making it a critical, yet often overlooked, factor in investment success. |
| Related Concepts |
What is a Liquid Stock
Imagine you’re at a bustling farmers’ market trying to sell a rare, exotic fruit. It might take time to find a buyer, and you may have to lower your price. Now, imagine selling a popular, common apple. You’d find a buyer instantly at the going rate. A liquid stock is the “apple” of the financial markets.
In plain terms, a liquid stock has a high level of trading activity, meaning there are always plenty of buyers and sellers. This constant activity creates a tight, efficient market where your orders to buy or sell are filled quickly and at a price very close to the last traded price.
Key Takeaways
The Core Concept Explained
Liquidity is primarily measured by two intertwined factors:
Trading Volume: The number of shares traded in a day. A high Average Daily Volume (ADV), often in the millions for major US stocks, indicates strong interest and a deep pool of participants.
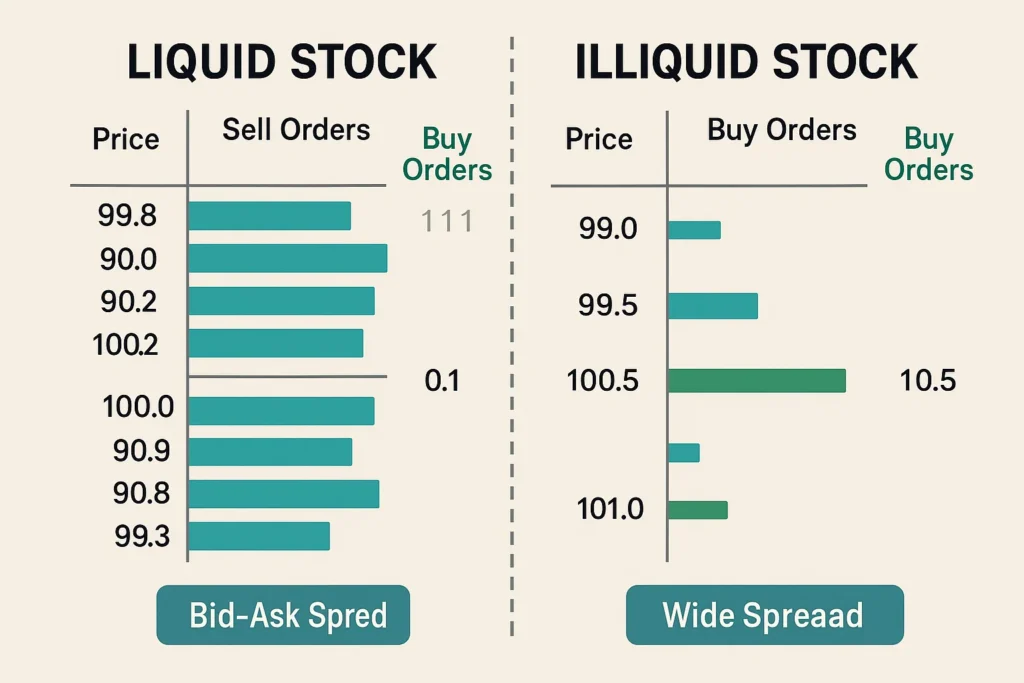
Bid-Ask Spread: The difference between the highest price a buyer is willing to pay (bid) and the lowest price a seller is willing to accept (ask). In a liquid stock, this spread is very narrow (e.g., one cent).
A stock with high volume and a tight spread is considered highly liquid. The constant battle between buyers and sellers keeps the price discovery process efficient. A low-volume stock, however, has a wide bid-ask spread. A single large order can dramatically move the price, as there aren’t enough orders on the other side to absorb it.
The Institutional Perspective on Liquidity
For retail traders, buying a few hundred shares of Apple is instant. For a mutual fund wanting to buy $500 million of Apple, it’s a complex logistical operation. They must work with dedicated trading desks to “work the order,” using algorithms like VWAP (Volume-Weighted Average Price) to slice a large order into smaller pieces throughout the day to minimize market impact. This highlights that liquidity is relative; a stock liquid enough for a retail trader may be illiquid for a large institution. Understanding this dynamic explains why large funds favor mega-cap stocks and why a stock’s liquidity can limit its institutional ownership.
Liquidity Across Different Asset Classes
Liquidity isn’t just a stock market concept. Comparing it across assets provides deeper insight:
- Forex: The most liquid market in the world (e.g., EUR/USD), with 24-hour trading and extremely tight spreads due to the massive, decentralized global volume.
- Large-Cap Stocks: As discussed, highly liquid with strong central exchanges.
- Corporate Bonds: Often surprisingly illiquid. An individual bond may not trade for days, with large bid-ask spreads. This is why bond ETFs have become so popular, they add a layer of liquidity to an otherwise illiquid asset class.
- Real Estate: The quintessential illiquid asset. Selling a property can take months and involves significant transaction costs, the polar opposite of a liquid stock.
How to Measure Stock Liquidity
While there’s no single “liquidity formula,” traders use a combination of metrics to gauge it effectively.
Key Metrics to Analyze
- Average Daily Volume (ADV): Look for stocks with an ADV consistently above 500,000 to 1 million shares. For institutional investors, this number needs to be in the tens of millions.
- Bid-Ask Spread: Calculate it as a percentage of the stock price: (Ask Price – Bid Price) / Stock Price. A spread below 0.1% is typically excellent for a liquid stock.
- Market Depth: This shows the number of buy and sell orders sitting at different price levels beyond the best bid and ask. A deep market can absorb larger orders.
Example Analysis: Apple Inc. (AAPL) vs. A Small-Cap Stock
| Metric | Apple (AAPL) – Liquid | Small-Cap XYZ – Illiquid |
|---|---|---|
| Average Daily Volume | ~50-60 million shares | ~50,000 shares |
| Stock Price | ~$200 | ~$10 |
| Bid-Ask Spread | $200.00 – $200.01 | $9.95 – $10.10 |
| Spread % | 0.005% | 1.5% |
| Interpretation | Minimal cost, instant execution. | High cost, potential for significant price impact on a market order. |
10 Most Liquid Stocks of 2026
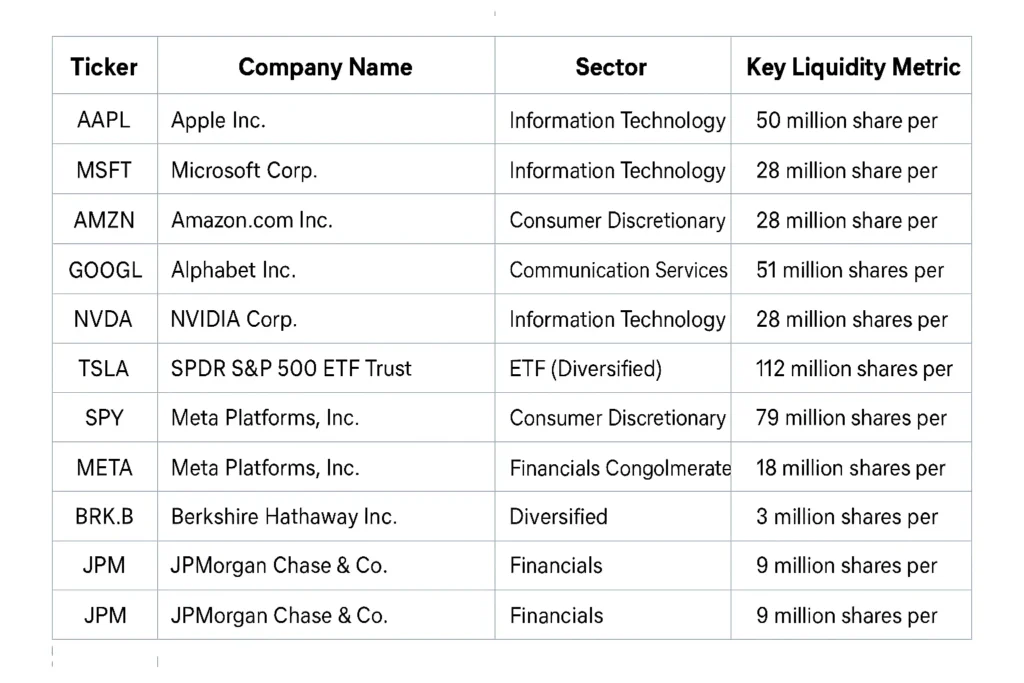
The following list comprises some of the most liquid stocks traded on U.S. exchanges. These companies are characterized by massive market capitalizations, high average daily trading volumes, and extremely tight bid-ask spreads, making them core holdings for institutions and prime candidates for active traders. Note: Data is representative and can change daily.
1. Apple Inc. (AAPL)
Sector: Information Technology
As one of the largest companies in the world by market cap, AAPL consistently trades over 50 million shares daily. Its status as a component of the Dow Jones Industrial Average, S&P 500, and NASDAQ 100 ensures constant demand from index funds and active managers alike, resulting in razor-thin spreads.
2. Microsoft Corp. (MSFT)
Sector: Information Technology
A direct competitor to Apple for the top market cap spot, MSFT boasts similar deep liquidity. Its diverse revenue streams (cloud with Azure, software, gaming) attract a wide range of investors, creating a stable and continuous flow of orders on both the buy and sell side.
3. Amazon.com Inc. (AMZN)
Sector: Consumer Discretionary
Despite its higher share price, AMZN’s volume is consistently high, often exceeding 25 million shares per day. Its dominance in e-commerce and cloud computing makes it a must-own stock for many funds, providing a deep and resilient order book.
4. Alphabet Inc. (GOOGL)
Sector: Communication Services
The parent company of Google benefits from immense liquidity across both its share classes (GOOGL and GOOG). Its role as the global leader in digital advertising generates enormous cash flow, making it a “defensive growth” stock that sees high turnover from all investor types.
5. NVIDIA Corp. (NVDA)
Sector: Information Technology
The poster child of the AI revolution, NVDA has seen its liquidity explode alongside its price. Daily volumes frequently surpass 30 million shares. While its volatility is higher than other mega-caps, the market depth is immense, allowing for large positions to be moved with relative ease.
6. Tesla, Inc. (TSLA)
Sector: Consumer Discretionary
TSLA is a prime example of a stock that is both highly liquid and highly volatile. It commands enormous retail and institutional interest, leading to massive daily volume. This liquidity allows traders to capitalize on its large price swings without being hindered by wide spreads.
7. SPDR S&P 500 ETF Trust (SPY)
Sector: ETF (Diversified)
While not a single stock, SPY is arguably the most liquid equity-traded security in the world. It often trades over 50 million shares daily with a bid-ask spread of often just one penny. It is the go-to instrument for gaining instant, low-cost exposure to the entire U.S. large-cap market.
8. Meta Platforms, Inc. (META)
Sector: Communication Services
The owner of Facebook, Instagram, and WhatsApp has a massive shareholder base. After its rebranding and focus on the metaverse and AI, it has regained favor on Wall Street, leading to robust daily trading volume and excellent liquidity for investors of all sizes.
9. Berkshire Hathaway Inc. (BRK.B)
Sector: Financials (Conglomerate)
The “B-share” of Warren Buffett’s conglomerate was created specifically to provide liquidity and accessibility to a wider pool of investors. It trades millions of shares daily and is a liquid way to gain a diversified, value-oriented portfolio in a single security.
10. JPMorgan Chase & Co. (JPM)
Sector: Financials
As the largest bank in the United States, JPM is a bellwether for the financial sector and the broader economy. It is a highly liquid component of the Dow Jones Industrial Average, with substantial daily volume driven by both fundamental and macroeconomic traders.
Why Stock Liquidity Matters to Traders and Investors
- For Traders: Liquidity is oxygen. Day traders and swing traders rely on it to enter and exit positions within seconds or minutes at predictable prices. An illiquid stock can trap a trader in a losing position or cause substantial slippage, wiping out potential profits.
- For Investors: While long-term “buy-and-hold” investors are less concerned with daily entry/exit, liquidity still matters. When it’s time to rebalance a portfolio or take profits, being able to sell a large position without crashing the price is crucial. Furthermore, liquidity provides confidence that the market price is a fair reflection of value.
- For Analysts: Liquidity is a key indicator of a company’s maturity and market confidence. A sudden drop in liquidity can be a red flag, signaling declining investor interest or underlying problems.
How to Use Liquidity in Your Trading Strategy
Case 1: Screening for Tradeable Assets
Before you even look at a chart, screen for stocks with high average volume. Most trading platforms allow you to set a minimum volume filter (e.g., >1 million shares). This immediately filters out the vast majority of risky, illiquid stocks.
Case 2: Timing Your Entry and Exit
Even for a liquid stock, liquidity can vary. The highest volume and tightest spreads are often during the first and last hours of the trading day in the stock’s primary market (e.g., 9:30 AM – 10:30 AM ET for US markets). Placing large orders during these times can minimize your market impact.
Case 3: Avoiding Slippage in Fast Markets
During high-volatility events (earnings reports, Fed announcements), liquidity can temporarily evaporate, and spreads can widen dramatically. Using limit orders instead of market orders ensures you never pay more than your predetermined price.
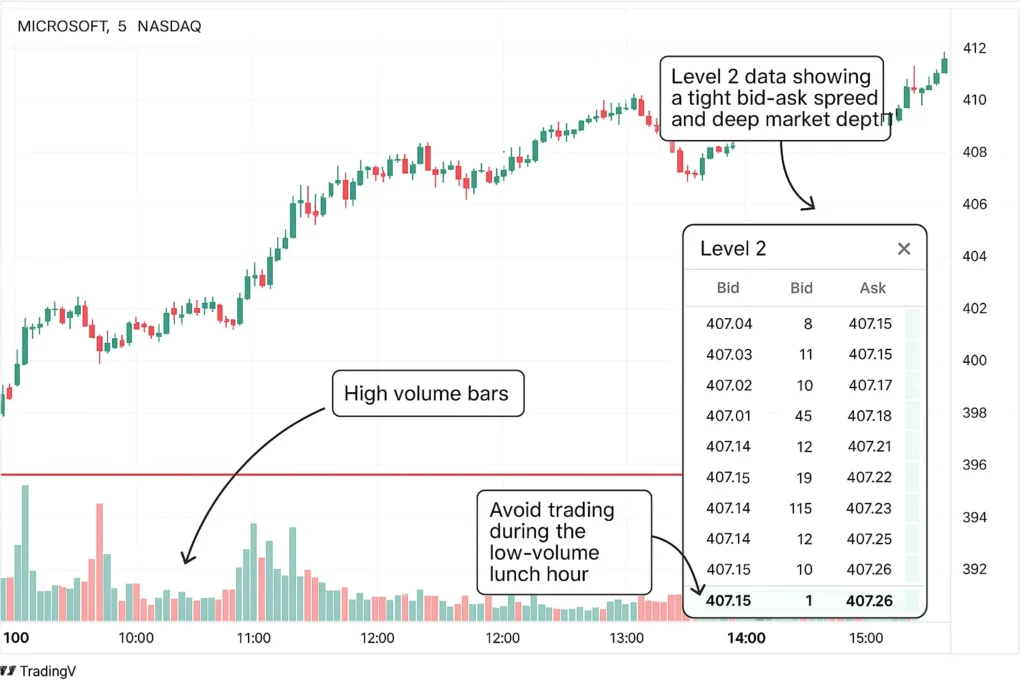
Visual Aid Description: A screenshot from a platform like TradingView showing the chart for Microsoft (MSFT). Annotations should highlight: 1) The high volume bars. 2) The Level 2 data window showing a tight bid-ask spread and deep market depth. 3) A note about avoiding trading during the low-volume lunch hour.
(Place this screenshot in the “Practical Application” section.)
To start screening for highly liquid stocks with professional-grade tools, you need a robust brokerage platform. We’ve tested the top contenders in our guide to the Best Online Brokers for Active Traders.
- Lower Transaction Costs: Tight bid-ask spreads mean you keep more of your profits.
- Price Stability: High liquidity acts as a cushion against sharp, erratic price moves caused by small trades.
- Ease of Execution: You can get in and out of positions with ease.
- Potentially Lower Growth Potential: The most explosive, multi-bagger growth often comes from small, illiquid companies before they are discovered by the masses.
- False Sense of Security: A liquid stock can still be extremely volatile and risky (e.g., Tesla during its high-growth phase).
- Crowded Trades: High liquidity sometimes means a stock is a crowded trade, where everyone has the same idea, increasing correlation and systemic risk.
Liquid Stock in the Real World: The GameStop (GME) Saga
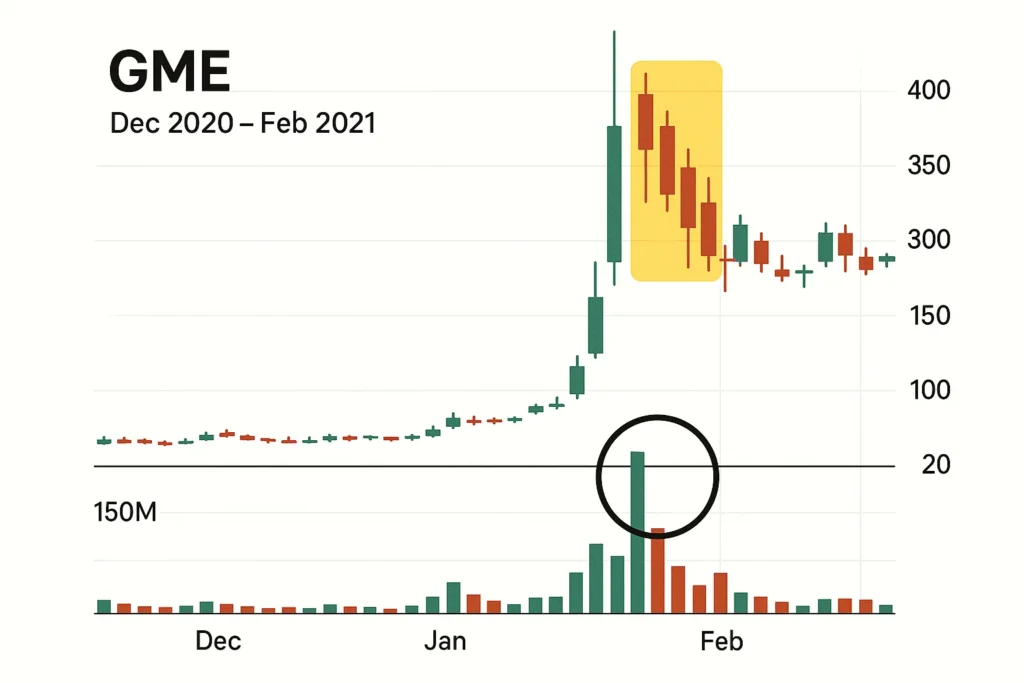
The GameStop short squeeze of January 2021 provides a masterclass in how liquidity can change in an instant. GME was a relatively illiquid, struggling brick-and-mortar stock for years. However, when a swarm of retail traders coordinated buying, the trading volume exploded from a few million shares per day to over 150 million shares in a single day.
This massive influx of orders created a hyper-liquid but wildly volatile environment. While it allowed many traders to enter and exit, the volatility was so extreme that slippage was enormous. A market order to buy could be filled dozens of dollars above the intended price. This event highlighted that while volume is a component of liquidity, stability is its crucial partner. True, healthy liquidity is both high-volume and stable, not explosive and chaotic.
Visual Aid Description: A chart of GME stock from December 2020 to February 2021. The chart should have two key annotations: 1) A circle around the volume bar showing the 150M+ share day, dwarfing all previous bars. 2) A highlighted area on the price chart showing a massive intraday spike and drop, illustrating the slippage and volatility despite high volume.
(Place this chart in the “Real-World Example” section.)
Conclusion
Ultimately, understanding and prioritizing stock liquidity is a non-negotiable component of prudent risk management. It is the factor that silently reduces your trading costs, enables strategic flexibility, and protects you from the hidden dangers of slippage and inefficient pricing. As we’ve seen, even in high-volume events like the GME squeeze, a lack of stable liquidity can be detrimental. While liquid stocks may not always offer the allure of unknown penny stocks, their predictability and efficiency make them the foundational building blocks of a robust, long-term portfolio. Start incorporating liquidity checks into your pre-trade routine today; your profitability will thank you.
Ready to build a portfolio with optimally liquid assets? The foundation is a broker that provides the necessary data and execution quality. Explore our curated list of the [Best Online Brokers for Long-Term Investors] to find a platform that fits your strategy.
How Liquid Stock Relates to Other Concepts
A common point of confusion is the difference between a liquid stock and a volatile stock.
| Feature | Liquid Stock | Volatile Stock |
|---|---|---|
| What it measures | Ease of trade execution & transaction cost. | The degree of price fluctuations over time. |
| Primary Metric | Average Daily Volume, Bid-Ask Spread | Beta, Standard Deviation, Average True Range (ATR) |
| Primary Use | Risk management and cost efficiency. | Gauging profit potential and price risk. |
| Relationship | Can be highly liquid AND highly volatile (e.g., TSLA). | Can be highly volatile AND illiquid (e.g., a micro-cap biotech). |
Related Terms
- Bid-Ask Spread: The direct cost of trading a stock, which is determined by its liquidity.
- Volume: The fuel for liquidity; a key component in its measurement.
- Market Depth: A visual representation of a stock’s liquidity at various price levels.
- Slippage: The negative consequence of trading an illiquid stock, especially with market orders.
Frequently Asked Questions
Recommended Resources
- Advanced Guide to Reading Level 2 Market Data
- How to Calculate and Use the Bid-Ask Spread
- U.S. Securities and Exchange Commission (SEC) – Investor Bulletin: Market Liquidity
- Investopedia – Liquidity Definition
