TRUMP (TRUMP) Price Analysis Bullish Breakout Imminent, Targeting $8.43
TRUMP’s price has been consolidating in a bullish flag pattern after a strong rally from recent lows. This price action suggests a bullish bias is forming, with momentum building for a continuation move. Our analysis projects a move towards a primary target of $8.43, representing a potential 21% gain from the current price. This prediction is based on a confluence of technical factors, including a key support hold, bullish pattern formation, and positive momentum divergence.
Current Market Structure and Price Action
The short-term market structure is bullish, characterized by a series of higher lows since the last significant swing low. The price is currently interacting with a crucial support zone between $6.80 and $7.00. Recent price action on the 4-hour chart has shown a low volatility compression within a descending channel or bull flag pattern, which typically resolves in the direction of the prior trend (up). This indicates that a bullish breakout may be imminent.
Identification of the Key Support Zone
The most critical technical element is the Strong Support Zone around $6.80 – $7.00. The strength of this zone is derived from:
- Historical Significance: This level has acted as both resistance and support in recent trading sessions, with multiple bounces confirming its importance.
- Technical Confluence: The zone aligns with the 200-period Exponential Moving Average (EMA) on the 4-hour chart and a 38.2% Fibonacci retracement level from the recent up-move, adding significant technical weight.
- Market Psychology: The $7.00 level is a key psychological round number where buyer interest has historically intensified.
This multi-layered confluence makes it a high-probability level for a bullish reaction and the launchpad for the next leg higher.
Technical Targets and Rationale
Our analysis identifies the following price target(s):
Primary Target (PT1): $8.43
This level represents the 1.618 Fibonacci extension level of the recent corrective wave within the bull flag. It also coincides with the previous major swing high, making it a logical profit-taking zone.
Secondary Target (PT2): $9.00+
This is a more ambitious target, acting as a key psychological resistance level. A decisive break above $8.43 with high volume could open the path for a run towards this zone.
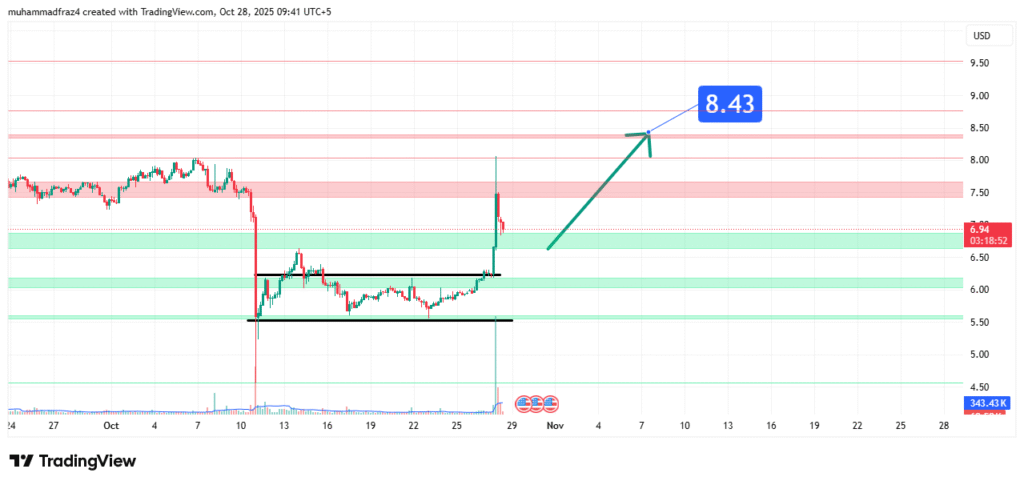
Prediction: We forecast that the price will hold above the $6.80 support, break above the flag pattern’s upper trendline (near $7.20), and accelerate towards our primary target at $8.43.
Risk Management Considerations
A professional strategy is defined by its risk management.
- Invalidation Level (Stop-Loss): The entire bullish thesis is invalidated if the price achieves a daily close below $6.60. This level is placed below the key support zone and the recent higher low, representing a clear break of the bullish market structure.
- Position Sizing: Any long positions taken should be sized so that a loss triggered at the $6.60 invalidation level represents a small, pre-defined percentage of your total capital (e.g., 1-2%).
Fundamental Backdrop
The technical setup is framed by the current fundamental landscape:
- Political Narrative: As a political meme coin, TRUMP’s price is highly sensitive to news and sentiment surrounding the U.S. presidential election and related events. Increased media attention can lead to volatile spikes.
- Meme Coin Sector Sentiment: The asset’s performance is partially tied to the broader health of the meme coin sector and overall risk appetite in cryptocurrency markets.
- On-Chain Activity: Monitoring wallet growth and large transaction volume can provide early signals of increasing or waning interest.
These factors contribute to the volatile but currently bullish-leaning sentiment surrounding the asset.
Conclusion
TRUMP is at a technical inflection point. The weight of evidence from the bull flag pattern, key support confluence, and momentum suggests a bullish resolution, targeting a 21% move to $8.43. Traders should monitor for a confirmed breakout above $7.20 with increasing volume and manage risk diligently by respecting the key invalidation level at $6.60. The reaction at the $8.43 target zone will be crucial for determining if the rally can extend towards $9.00.
Chart Source: TradingView
Disclaimer: This analysis is for informational and educational purposes only and does not constitute financial advice or a recommendation to buy or sell any security. All trading and investing involves significant risk, including the possible loss of your entire investment. Always conduct your own research (DYOR) and consider seeking advice from an independent financial professional before making any trading decisions.
