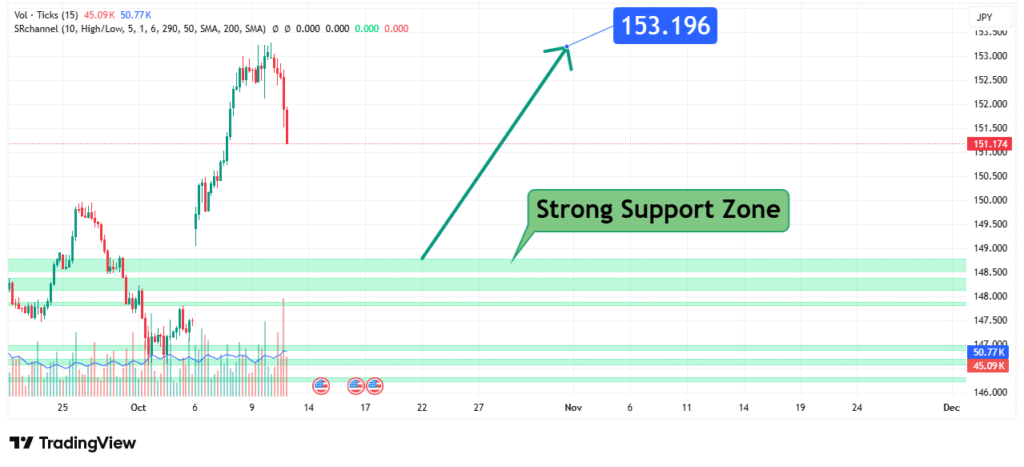
USDJPY Price Analysis Bullish Rebound Targets 153.196
USD/JPY’s price has been consolidating and showing signs of basing after a significant decline from the 152.00+ highs. The price is now interacting with a historically significant support zone. Our analysis indicates a bullish bias is forming, projecting a rally towards a primary target of 153.196. This prediction is based on a confluence of technical factors, including the defense of a strong support zone and a potential shift in market structure.
Current Market Structure and Price Action
The broader market structure has been bearish, characterized by a series of lower highs and lower lows throughout November and December. However, the price is now interacting with a strong support zone between 147.000 and 148.000. The recent price action shows a clear deceleration in bearish momentum as this zone is tested, indicating that a bullish reversal or a significant corrective bounce may be imminent. The ability of the price to hold above this critical area suggests potential buyer accumulation.
Identification of the Key Support Zone
The most critical technical element is the Strong Support Zone explicitly marked on the chart, with a core focus at 147.000. The strength of this zone is derived from:
- Historical Significance: This level has acted as a major consolidation area and a springboard for previous rallies, as evidenced by the price action in October.
- Technical Confluence: The zone aligns with a key psychological round number (147.000), which often serves as a magnet for price action and a level where institutional orders are clustered.
- Market Psychology: This area represents a point where the sentiment of sellers is likely to be overwhelmed by buyers perceiving value, leading to profit-taking on short positions and new long entries.
This confluence makes it a high-probability level for a strong bullish reaction.
Technical Target(s) and Rationale
Our analysis identifies the following price target:
- Primary Target (PT1): 153.196
- Rationale: This level is identified on the provided chart as the primary objective following a successful hold of the strong support. It represents a previous major swing high and a key resistance level that, if broken, could signal a resumption of the broader uptrend. Reaching this target would constitute a significant recovery of the recent bearish move, effectively invalidating the lower high structure.

Prediction: We forecast that the price will bounce decisively from the 147.000-148.000 support zone and rally towards our primary target at 153.196.
Risk Management Considerations
A professional strategy is defined by its risk management.
- Invalidation Level (Stop-Loss): The entire bullish thesis is invalidated if the price achieves a sustained daily close below the strong support zone, notably below 146.500. This level represents a clear breakdown of the market structure that justifies the prediction, indicating that bearish momentum has overpowered the identified support.
- Position Sizing: Any long positions taken should be sized so that a loss triggered at the invalidation level below 146.500 represents a small, pre-defined percentage of your total capital (e.g., 1-2%).
Fundamental Backdrop
The technical setup is framed by the current fundamental landscape:
- US Federal Reserve vs. Bank of Japan Policy Divergence: The core driver for USD/JPY remains the wide interest rate differential. Any hawkish commentary from the Fed or reaffirmation of their “higher for longer” stance would be a strong tailwind for this bullish setup.
- Bank of Japan (BoJ) Policy Pivot Uncertainty: While there is speculation about the BoJ ending its negative interest rate policy, any delay or cautious communication from the BoJ would weaken the Yen and support a USD/JPY rally.
- Risk Sentiment: Global risk appetite tends to weaken the safe-haven JPY, providing additional fuel for a USD/JPY up-move.
These factors contribute to the potential bullish sentiment surrounding the pair if the technical support holds.
Conclusion
USD/JPY is at a critical technical inflection point, testing a formidable support zone. The weight of evidence suggests a bullish resolution, targeting a rally to 153.196. Traders should monitor for a confirmed bounce from the 147.000-148.000 area and manage risk diligently by respecting the key invalidation level below 146.500. A successful rebound at this juncture could signal the end of the recent corrective phase.
Chart Source: TradingView
Disclaimer: This analysis is for informational and educational purposes only and does not constitute financial advice or a recommendation to buy or sell any security. All trading and investing involves significant risk, including the possible loss of your entire investment. Always conduct your own research (DYOR) and consider seeking advice from an independent financial professional before making any trading decisions.


