What Is Beta and How to Use It for Smarter Investing
Beta is the definitive measure of a stock’s volatility relative to the overall market. It quantifies systematic risk, helping investors in the US, UK, Canada, and Australia understand how much bumpiness to expect from an investment compared to a benchmark like the S&P 500. Mastering Beta is fundamental to building a portfolio that aligns with your risk tolerance and investment goals.
For investors in the US, UK, Canada, and Australia, using Beta with local benchmarks like the S&P 500, FTSE 100, S&P/TSX Composite, or ASX 200 is a cornerstone of modern, risk-aware portfolio construction.
Summary Table
| Aspect | Detail |
|---|---|
| Definition | A measure of a stock’s volatility and systematic risk compared to the overall market. |
| Also Known As | Beta Coefficient, Systematic Risk Measure |
| Main Used In | Portfolio Management, Stock Analysis, Capital Asset Pricing Model (CAPM) |
| Key Takeaway | Beta measures risk, not performance. A high Beta means higher volatility, not necessarily higher returns. |
| Formula | β = Covariance(Stock Returns, Market Returns) / Variance(Market Returns) |
| Related Concepts |
What is Beta
In simple terms, Beta tells you how jumpy a stock is compared to the market. If the market moves up or down by 1%, by how much does a particular stock tend to move? It’s a core component of the Capital Asset Pricing Model (CAPM), which is used to calculate expected returns.
Analogy: Think of the stock market as the ocean and individual stocks as boats.
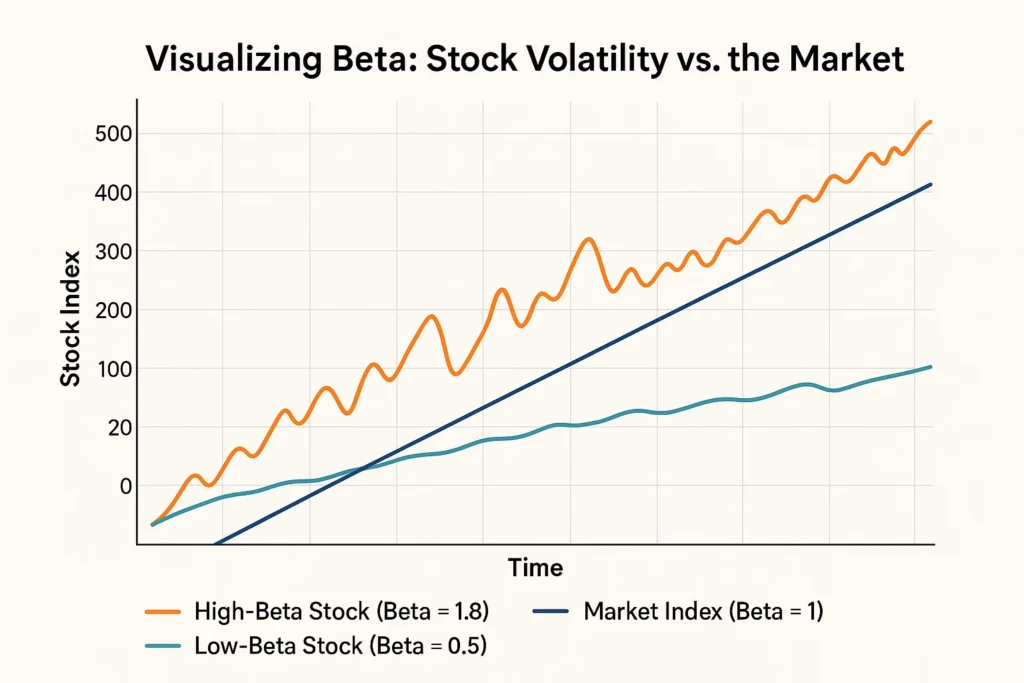
- A Beta of 1 is a speedboat that moves exactly with the waves. If a wave is 3 feet high, the boat goes up 3 feet.
- A Beta greater than 1 (e.g., 1.5) is a jet ski. It’s much more volatile. A 3-foot wave might make it jump 4.5 feet.
- A Beta less than 1 (e.g., 0.5) is a large cargo ship. It’s more stable. A 3-foot wave might only make it rise 1.5 feet.
- A Negative Beta is a submarine that sometimes moves in the opposite direction of the waves, which is very rare.
Key Takeaways
The Core Concept Explained
Beta measures a stock’s sensitivity to market movements, specifically non-diversifiable systematic risk. This is the risk that affects the entire market, such as interest rate changes, recessions, or geopolitical events.
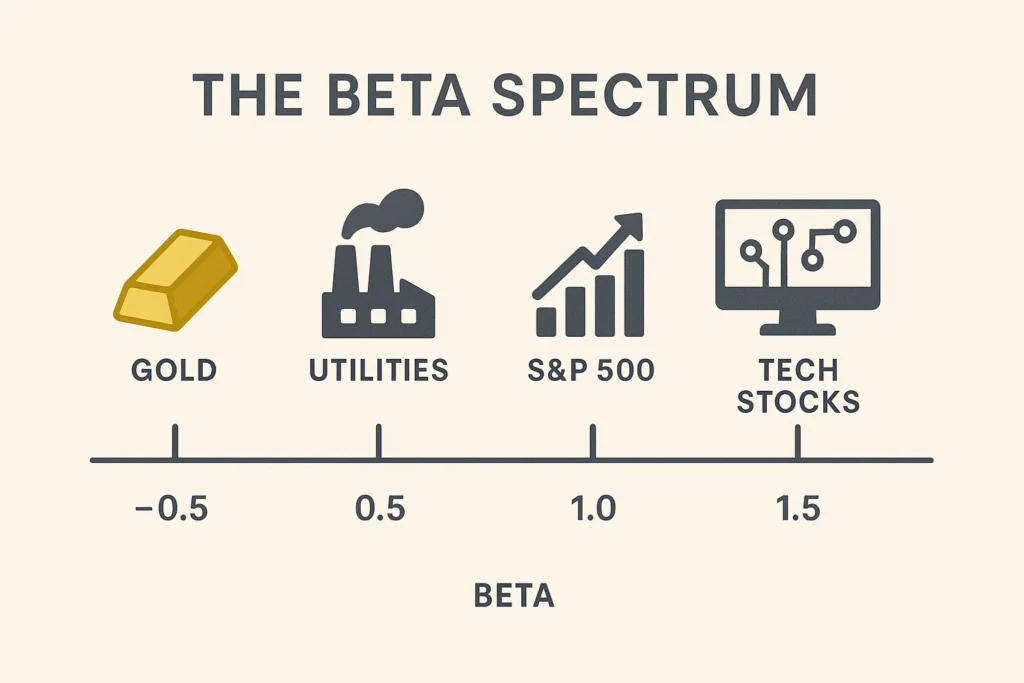
- Beta = 1: The stock moves in line with the market.
- Beta > 1: The stock is more volatile than the market. Technology stocks often have high Betas.
- Beta < 1 (but > 0): The stock is less volatile than the market. Utilities and consumer staples are classic low-Beta stocks.
- Beta = 0: The stock’s returns are uncorrelated with the market (e.g., cash).
- Beta < 0: The stock moves in the opposite direction of the market. Gold and some inverse ETFs are examples.
How to Calculate Beta
The formula for Beta is derived from regression analysis.
Formula:
β = Covariance(R<sub>i</sub>, R<sub>m</sub>) / Variance(R<sub>m</sub>)
Where:
- R<sub>i</sub> = The return of the individual stock
- R<sub>m</sub> = The return of the overall market
- Covariance = Measures how two stocks move together
- Variance = Measures how far the market’s returns deviate from its average
Step-by-Step Calculation Guide
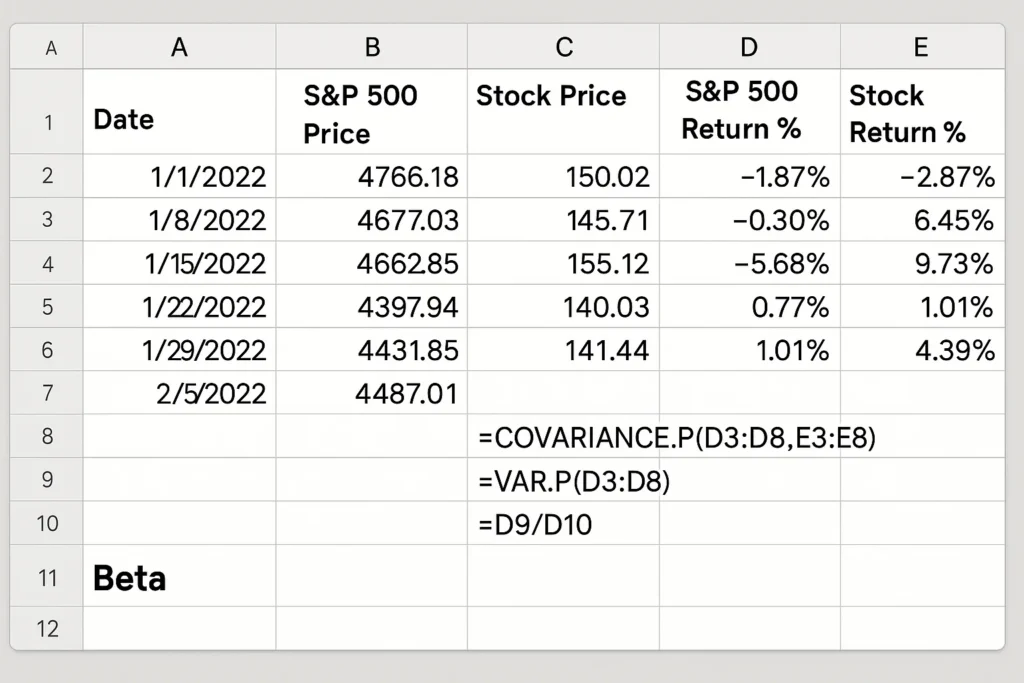
In practice, you would use a spreadsheet or financial data platform. Here’s the conceptual process:
- Choose a Benchmark: Select a market index (e.g., S&P 500 for US stocks).
- Gather Data: Collect historical price data for both the stock and the index over a specific period (e.g., 5 years of monthly returns).
- Calculate Returns: Compute the periodic returns for both the stock and the index.
- Compute Covariance and Variance: Use the returns data to calculate the covariance between the stock and the market and the variance of the market.
- Divide: Divide the covariance by the variance to get the Beta.
Example Calculation:
Let’s calculate the Beta for a hypothetical tech stock, TechNovate, against the S&P 500.
| Input Values | |
| Covariance (TechNovate, S&P 500) | 0.04 |
| Variance (S&P 500) | 0.02 |
Calculation:
β = 0.04 / 0.02 = 2.0
Interpretation: A Beta of 2.0 indicates that TechNovate is theoretically twice as volatile as the S&P 500. If the S&P 500 goes up 1%, TechNovate is expected to go up 2%. If the market drops 1%, TechNovate is expected to drop 2%.
An investor in the UK would use the FTSE 100 as their benchmark, while an Australian investor would use the ASX 200. The calculation method remains the same, but the relevant market index changes.
Why Beta Matters to Traders and Investors
- For Investors: Beta is crucial for portfolio construction and asset allocation. A retiree seeking stable income would build a portfolio of low-Beta assets to preserve capital. A young investor with a long time horizon might intentionally include high-Beta stocks for greater growth potential.
- For Traders: Short-term traders can use Beta to gauge a stock’s potential for large price swings. A high-Beta stock might be attractive for momentum trading but dangerous in a volatile or bearish market.
- For Analysts and Fund Managers: Beta is the cornerstone of the Capital Asset Pricing Model (CAPM), which is used to determine a theoretically appropriate required rate of return for an asset, factoring in its stake with respect to the market.
How to Use Beta in Your Strategy
Use Case 1: Building a Risk-Adjusted Portfolio
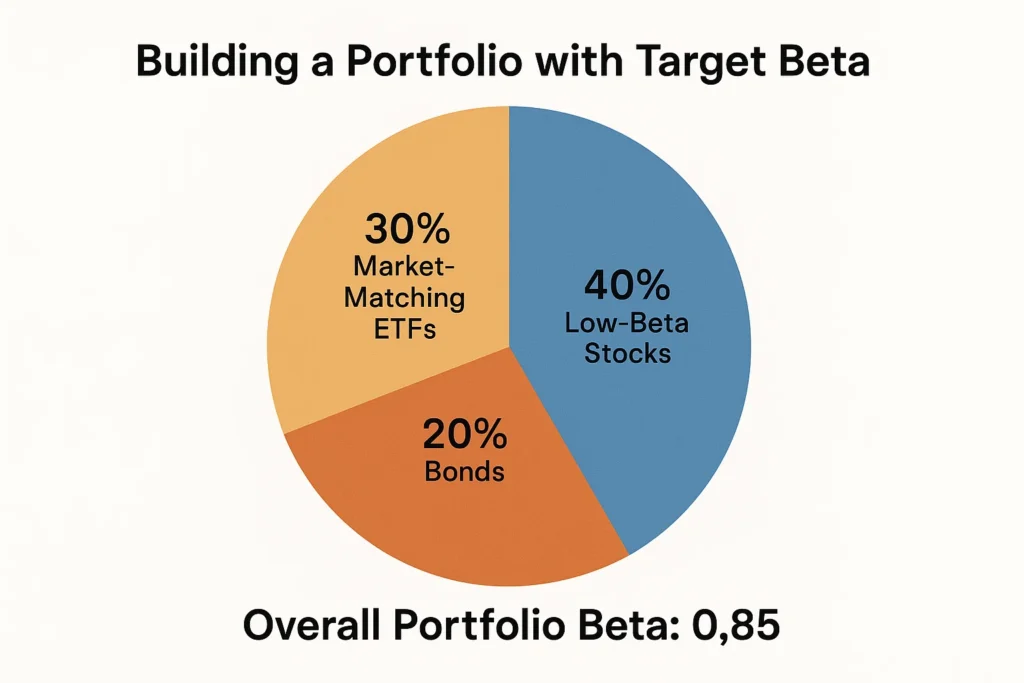
An investor wanting moderate growth with less volatility might aim for a portfolio with an average Beta of 0.8 to 0.9. This can be achieved by mixing stocks with different Betas. For example, balancing high-Beta tech stocks with low-Beta utility stocks and bonds (which often have Betas near zero).
Use Case 2: Defensive Positioning in a Bear Market
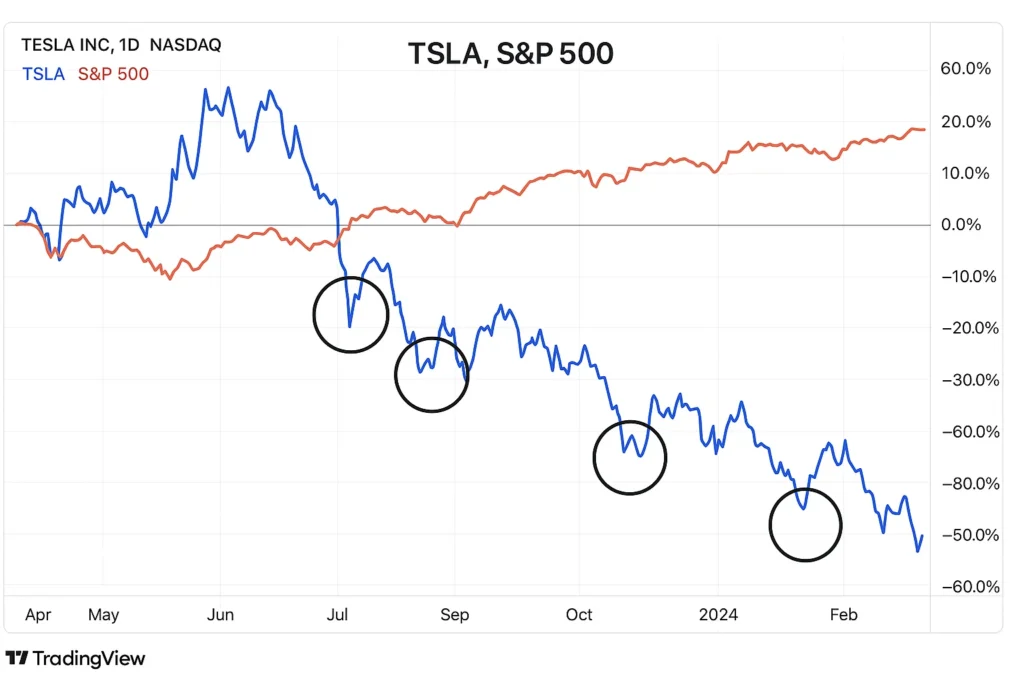
If economic indicators signal a potential downturn, an investor might rotate out of high-Beta stocks (e.g., luxury goods, semiconductors) and into low-Beta or defensive sectors (e.g., healthcare, consumer staples, utilities) to help protect their portfolio from the full brunt of a market decline.
To start analyzing the Beta of your current holdings or potential investments, you need a brokerage platform with robust screening and analytics tools. We’ve reviewed the best platforms for fundamental analysis to help you make an informed choice.
- Simple and Quantifiable: Provides a single, clear number to compare risk across different stocks.
- Foundation of Modern Finance: It’s a key input in the CAPM and Modern Portfolio Theory.
- Useful for Portfolio Construction: Essential for building a portfolio that matches a specific risk profile.
- Backward-Looking: Beta is calculated using historical data, which is not a reliable indicator of future volatility.
- Ignores Company-Specific Risk: It only measures systematic risk. A company could have a low Beta but be on the verge of bankruptcy (high unsystematic risk).
- Sensitive to Benchmark and Timeframe: The Beta value can change significantly depending on which market index you use and the time period you select for the calculation.
- Fails in Structural Shifts: It may be less reliable during market regime changes or financial crises when correlations between assets break down.
Levered vs. Unlevered Beta: Peeling Back the Risk Layers
The Beta you find on most financial websites (Yahoo Finance, Bloomberg) is Levered Beta (or Equity Beta). It reflects the risk of a company’s stock, including the risk introduced by its debt. This is crucial to understand because debt amplifies both gains and losses, making the company’s equity riskier.
To get a purer view of a company’s operational risk compared to its industry peers, analysts often calculate Unlevered Beta (or Asset Beta). This metric removes the financial effects of debt, allowing you to see how risky the business itself is, based solely on its industry and operations.
Why This Distinction Matters:
- For Stock Investors: Levered Beta is what you experience directly. A highly indebted company will have a higher Levered Beta, meaning its stock will be more volatile.
- For Analysts and Acquirers: Unlevered Beta is used for valuation models (like the Discounted Cash Flow model) because it represents the core business risk without the distortion of different capital structures. It allows for an apples-to-apples comparison of two companies in the same industry, even if one has no debt and the other is highly leveraged.
The Formulas in Action
The method of eliminating the effect of debt is called unlevering. The formula is:
Unlevered Beta = Levered Beta / [1 + (1 – Tax Rate) * (Debt/Equity)]
Conversely, you can relever a Beta to a different debt level:
Levered Beta = Unlevered Beta * [1 + (1 – Tax Rate) * (Debt/Equity)]
Case Study: Comparing Two Automakers
Let’s compare a hypothetical, conservatively financed AutoSafe Inc. with a highly leveraged AutoGear Ltd. Assume a corporate tax rate of 25%.
| Company | Levered Beta (from Yahoo Finance) | Debt/Equity Ratio | Unlevered Beta Calculation |
|---|---|---|---|
| AutoSafe Inc. | 1.1 | 0.5 | = 1.1 / [1 + (1-0.25)*0.5] = 1.1 / [1 + 0.375] = 0.8 |
| AutoGear Ltd. | 1.7 | 1.5 | = 1.7 / [1 + (1-0.25)*1.5] = 1.7 / [1 + 1.125] = 0.8 |
The Aha! Moment:
Both companies have an Unlevered Beta of 0.8. This tells us that the core business risk of being an automaker is identical for both. However, AutoGear’s higher Levered Beta of 1.7 is purely a result of its aggressive use of debt. As an investor, this means:
- AutoSafe (Beta 1.1) will be less volatile than the market.
- AutoGear (Beta 1.7) will be significantly more volatile than the market.
- In an economic boom, AutoGear’s stock might soar higher due to leverage. In a recession, it could fall much further as it struggles to service its debt.
This analysis provides a profound insight that a simple glance at the Levered Beta would miss, allowing for a much more sophisticated investment decision. For investors seeking a comprehensive risk assessment, tools like the Capital Asset Pricing Model (CAPM) can incorporate these nuanced Beta figures to determine a more accurate expected return, accounting for both
Performing this kind of advanced fundamental analysis requires access to detailed financial statements. For individual investors, screening tools that provide Debt/Equity ratios and other metrics are essential. Learn which financial data platforms offer the best value for serious investors.
The Beta of an Investment Portfolio
While understanding a single stock’s Beta is useful, most investors don’t put all their eggs in one basket. The true power of Beta is revealed when you use it to assess the systematic risk of your entire portfolio. A diversified portfolio’s overall Beta provides a much clearer picture of your aggregate exposure to market swings than looking at any single holding.
Your portfolio’s Beta is a weighted average of the Betas of all the individual securities within it. This means a single high-Beta stock won’t necessarily make your entire portfolio risky if it’s balanced by other, more stable investments.
How to Calculate Your Portfolio Beta
The formula is straightforward:
βportfolio = (w1 * β1) + (w2 * β2) + … + (wn * βn)Where:
- w = The weight (percentage) of each asset in the total portfolio value.
- β = The Beta of each individual asset.
Real-World Calculation: Building a Defensive Portfolio
Let’s construct a hypothetical $100,000 portfolio for an investor named Sarah, who is nearing retirement and wants moderate growth with less volatility than the overall market.
| Asset | Allocation | Value | Asset Beta | Weighted Beta Contribution |
|---|---|---|---|---|
| Vanguard S&P 500 ETF (VOO) | 40% | $40,000 | 1.0 | (0.40 * 1.0) = 0.40 |
| Utilities Sector ETF (XLU) | 25% | $25,000 | 0.5 | (0.25 * 0.5) = 0.125 |
| Consumer Staples Stock (e.g., PG) | 20% | $20,000 | 0.4 | (0.20 * 0.4) = 0.08 |
| US Treasury Bond ETF (VGIT) | 15% | $15,000 | 0.0* | (0.15 * 0.0) = 0.00 |
Portfolio Beta = 0.40 + 0.125 + 0.08 + 0.00 = 0.605
Bonds typically have a Beta very close to zero, as their returns are not highly correlated with stock market movements.
Interpretation and Actionable Insight:
Sarah’s portfolio has a Beta of approximately 0.61. This means:
- If the S&P 500 rises by 10%, her portfolio would be expected to rise by about 6.1%.
- If the S&P 500 falls by 10%, her portfolio would be expected to fall by only about 6.1%.
This calculated, low-Beta portfolio aligns perfectly with her goal of capital preservation while still allowing for participation in market gains. By knowing her portfolio Beta, Sarah can make informed decisions. If she felt this was still too risky, she could further reduce her allocation to VOO and increase it in utilities or bonds to lower the Beta even more.
Manually calculating your portfolio Beta can be tedious. To track your portfolio’s risk in real-time, you need a brokerage platform with advanced portfolio analytics tools. See how the top platforms stack up in our independent guide to the best portfolio management software.
Beta in the Real World: A Case Study
The Tale of Two Stocks: Microsoft vs. Delta Airlines (Hypothetical Scenario)
Let’s compare two companies from different sectors during a period of market stress, like the COVID-19 market crash of Q1 2020.
- Microsoft (MSFT): As a dominant tech company with stable revenue from cloud services and software, it has historically had a moderate Beta (often around 0.8-1). When the market (S&P 500) fell sharply in February-March 2020, Microsoft stock declined, but its decline was roughly in line with or slightly less severe than the broader market. Its business model was seen as resilient even during a lockdown.
- Delta Airlines (DAL): As an airline, it is highly sensitive to economic cycles and has a higher Beta (often above 1.3). During the same market crash, the S&P 500 fell significantly, but Delta’s stock price plummeted far more dramatically. The systematic risk of an economic shutdown impacted Delta with much greater force.
- Description: A comparative line chart showing the performance of a High-Beta ETF (e.g., SPDR S&P 500 High Beta ETF – SPHB) vs. a Low-Beta ETF (e.g., Invesco S&P 500 Low Volatility ETF – SPLV) during a specific volatile month, highlighting the difference in drawdowns.
Where to Add: In the Real-World Example section (8).
This case study shows how Beta correctly predicted the relative volatility and sensitivity of these two stocks to a major market downturn.
Beta (β) vs Alpha (α)
A common point of confusion is the difference between Beta and Alpha.
| Feature | Beta (β) | Alpha (α) |
|---|---|---|
| What it measures | Risk/Volatility relative to the market. | Excess Return/Performance relative to a benchmark. |
| Focus | Non-diversifiable, systematic risk. | Value added by the portfolio manager’s skill. |
| Formula Context | Input in the CAPM. | Output: Actual Return – Expected Return (from CAPM). |
| Primary Use | Portfolio construction and risk assessment. | Performance evaluation of active management. |
Conclusion
Understanding Beta provides a critical lens for evaluating investment risk and constructing a resilient portfolio. While it is a powerful and foundational tool for quantifying market volatility, as we’ve seen, it is not infallible due to its backward-looking nature and inability to capture company-specific dangers. By incorporating Beta into your overall strategy alongside other fundamental and technical analysis, you can make more informed, data-driven decisions that align with your personal risk tolerance. Start by looking up the Beta of the stocks you own or are considering on your brokerage’s research page.
Ready to analyze the risk profile of your portfolio? The right brokerage tools are essential. For a deep dive into platforms with the best screening and analytics features, check out this independent review of the best online brokers for research.
Related Terms
- Alpha: The measure of an investment’s performance on a risk-adjusted basis, indicating how much it has outperformed or underperformed its Beta-adjusted benchmark.
- Capital Asset Pricing Model (CAPM): A model that describes the relationship between systematic risk and expected return for assets, using Beta as a key component.
- Standard Deviation: A measure of total volatility (both systematic and unsystematic risk) of an asset’s returns.
- Sharpe Ratio: A metric for calculating risk-adjusted return, which uses standard deviation in its denominator instead of Beta.
- Modern Portfolio Theory (MPT): A theory on how risk-averse investors can construct portfolios to optimize or maximize expected return based on a given level of market risk, emphasizing the importance of correlation, of which Beta is a key part.
Frequently Asked Questions
Recommended Resources
- Investopedia: Beta Definition – A clear and authoritative explanation.
- SEC.gov: Educational resources on investment risk.
- Aswath Damodaran’s Website: The Dean of Valuation provides extensive data sets, including industry Betas, used in academic and professional settings.
How did this post make you feel?
Thanks for your reaction!
