Liquidity What It Is, Why It Matters, and How to Use It
Liquidity is the lifeblood of financial markets and a cornerstone of sound financial health. It measures how quickly and easily an asset can be converted into cash without significantly affecting its price. For traders and investors in the US, UK, Canada, and Australia, understanding liquidity is non-negotiable for managing risk and capitalizing on opportunities.
Summary Table
| Aspect | Detail |
|---|---|
| Definition | The ease of converting an asset to cash at its fair market value. |
| Also Known As | Market Depth, Cash Equivalents |
| Main Used In | Corporate Finance, Stock Trading, Portfolio Management, Banking |
| Key Takeaway | High liquidity means low risk of not being able to meet short-term obligations or exit a trade; low liquidity can lead to insolvency or costly trade executions. |
| Formula | Multiple, including Current Ratio = Current Assets / Current Liabilities |
| Related Concepts |
What is Liquidity
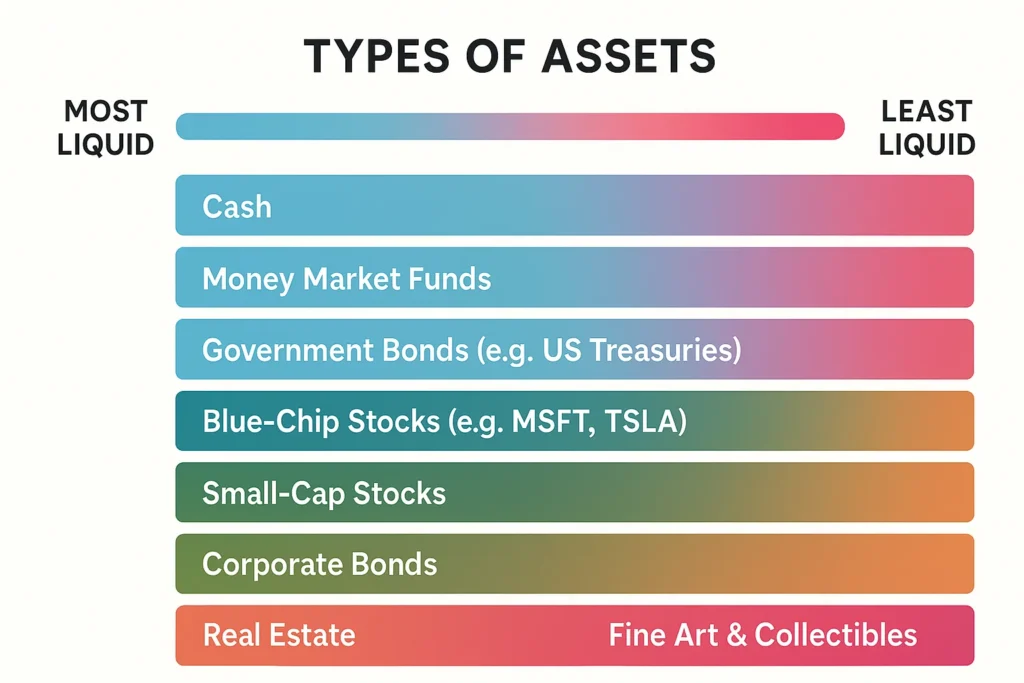
In simple terms, liquidity answers the question: “If I needed cash right now, how fast could I get it by selling what I own, and would I get a fair price?” Cash itself is the most liquid asset. A publicly traded stock like Apple (AAPL) on the NASDAQ is highly liquid, you can sell it in seconds for a price very close to the last traded value. On the other hand, a piece of real estate is illiquid; selling it quickly often requires a significant price discount.
Think of liquidity as the width of a river. A highly liquid market is a wide, deep river where many boats (trades) can pass through easily without affecting the water level (price). An illiquid market is a narrow stream where a single boat can cause waves and significantly change the water level.
The Core Concept Explained
Liquidity operates on two main levels:
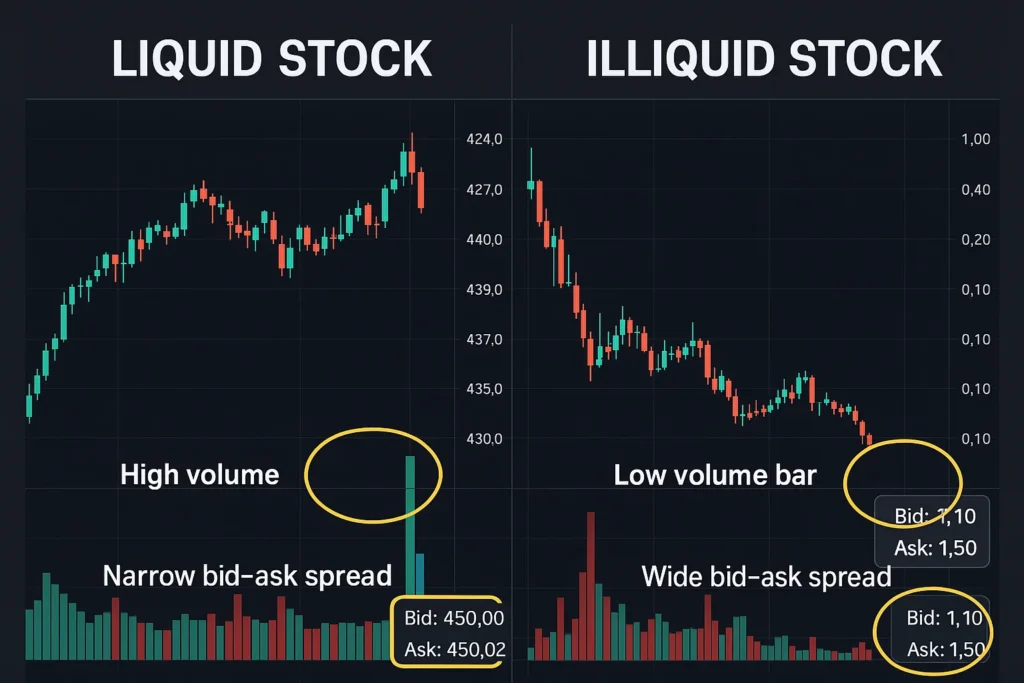
- Market Liquidity: This refers to the extent to which a market, like the New York Stock Exchange (NYSE) or the forex market, allows assets to be bought and sold at stable, transparent prices. High market liquidity is characterized by high trading volume and narrow bid-ask spreads.
- Accounting Liquidity: This measures a company’s or individual’s ability to meet their short-term financial obligations with the liquid assets they have on hand. It’s a key indicator of financial health and is assessed using ratios derived from the balance sheet.
A high degree of liquidity generally indicates lower risk, while low liquidity signals higher risk.

How to Calculate Liquidity
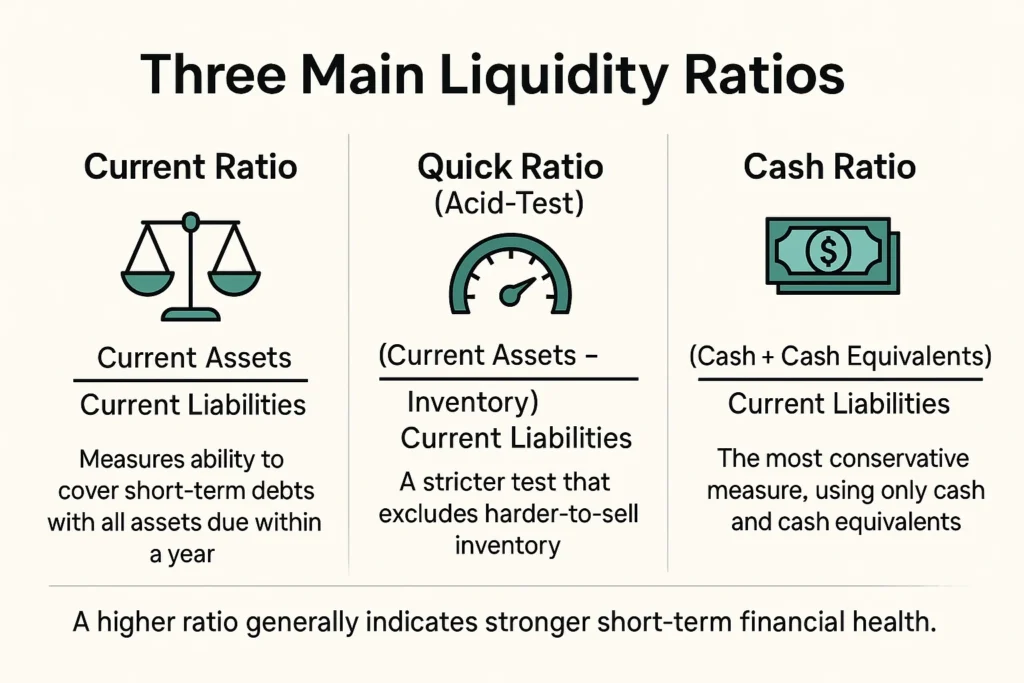
For companies, accounting liquidity is quantified using specific ratios. The most common are the Current Ratio, Quick Ratio, and Cash Ratio.
Step-by-Step Calculation Guide
Let’s break down the three primary liquidity ratios:

1. Current Ratio: Measures a company’s ability to pay off short-term liabilities with all its current assets.
- Formula: Current Ratio = Current Assets / Current Liabilities
- Components:
- Current Assets: Cash, Marketable Securities, Accounts Receivable, Inventory, Prepaid Expenses.
- Current Liabilities: Accounts Payable, Short-Term Debt, Accrued Expenses.
2. Quick Ratio (Acid-Test Ratio): A more stringent measure that excludes inventory from current assets, as inventory is not as easily converted to cash.
- Formula: Quick Ratio = (Current Assets – Inventory) / Current Liabilities
3. Cash Ratio: The most conservative ratio, measuring the ability to pay off short-term liabilities with only cash and cash equivalents.
- Formula: Cash Ratio = (Cash + Cash Equivalents) / Current Liabilities
Example Calculation: Analyzing a Hypothetical Company
Let’s evaluate “TechNovation Inc.,” a company listed on the NYSE, using its balance sheet data (in millions of USD).
| Input Values | Amount (USD) |
|---|---|
| Cash & Equivalents | $50 |
| Accounts Receivable | $30 |
| Inventory | $20 |
| Total Current Assets | $100 |
| Total Current Liabilities | $60 |
| Calculation | Formula | Result |
|---|---|---|
| Current Ratio | $100 / $60 | 1.67 |
| Quick Ratio | ($100 – $20) / $60 | 1.33 |
| Cash Ratio | $50 / $60 | 0.83 |
Interpretation: A current ratio above 1.0 indicates the company has more current assets than liabilities. A ratio of 1.67 is generally considered healthy. The quick ratio of 1.33 is strong, showing solid liquidity even without selling inventory. The cash ratio of 0.83 suggests the company could cover 83% of its short-term debts immediately with cash on hand, which is reasonable.
Why Liquidity Matters to Traders and Investors
- For Traders: Liquidity is paramount. A liquid stock like Amazon (AMZN) allows for quick entry and exit at predictable prices. In an illiquid stock, you might struggle to sell without accepting a much lower price (a wide bid-ask spread), directly impacting profits. Liquidity dries up during panic, making it hard to exit positions.
- For Investors: When building a portfolio, liquidity is a key risk management consideration. While long-term investors can tolerate the illiquidity of assets like real estate, they still need a liquid emergency fund or cash reserves to avoid selling investments at a bad time.
- For Analysts: Accounting liquidity ratios are vital for fundamental analysis. A declining current ratio can be an early warning sign of financial distress, even for a profitable company. Analysts compare these ratios against industry peers and historical trends to assess a company’s viability.
How to Use Liquidity in Your Strategy
Use Case 1: Screening for Financially Healthy Companies.
- Action: Use a stock screener (like those on TradingView or your brokerage platform) to filter for companies with a Current Ratio > 1.5 and a Quick Ratio > 1.0. This helps avoid companies with high short-term bankruptcy risk.
Use Case 2: Assessing Trade Entry/Exit Ease.
- Action: Before trading a stock, ETF, or cryptocurrency, check its average daily trading volume and bid-ask spread. For active trading, prioritize assets with high volume and tight spreads to minimize transaction costs.
Use Case 3: Personal Financial Planning.
- Action: Maintain a personal “current ratio.” Ensure you have enough liquid assets (savings account, money market funds) to cover 3-6 months of living expenses. This acts as a buffer against unexpected events.

Effectively applying these liquidity strategies requires a powerful and reliable trading platform. To find the best tools for screening stocks and analyzing market depth, check out our in-depth review of the Best Online Brokers for Technical Analysis.
- Risk Indicator: Provides a clear, quantifiable measure of financial health for companies and portfolios.
- Market Efficiency: High market liquidity leads to more accurate price discovery and lower transaction costs for everyone.
- Simplicity: Key ratios are easy to calculate from standard financial statements.
- Snapshot in Time: Balance sheet ratios are static and can change quickly.
- Doesn’t Guarantee Quality: A high current ratio can be misleading if a company has slow-moving inventory or uncollectible receivables.
- Industry Specific: A good ratio varies by industry. A tech company’s healthy ratio might be different from a utility company’s.
Liquidity in the Real World: The 2008 Financial Crisis
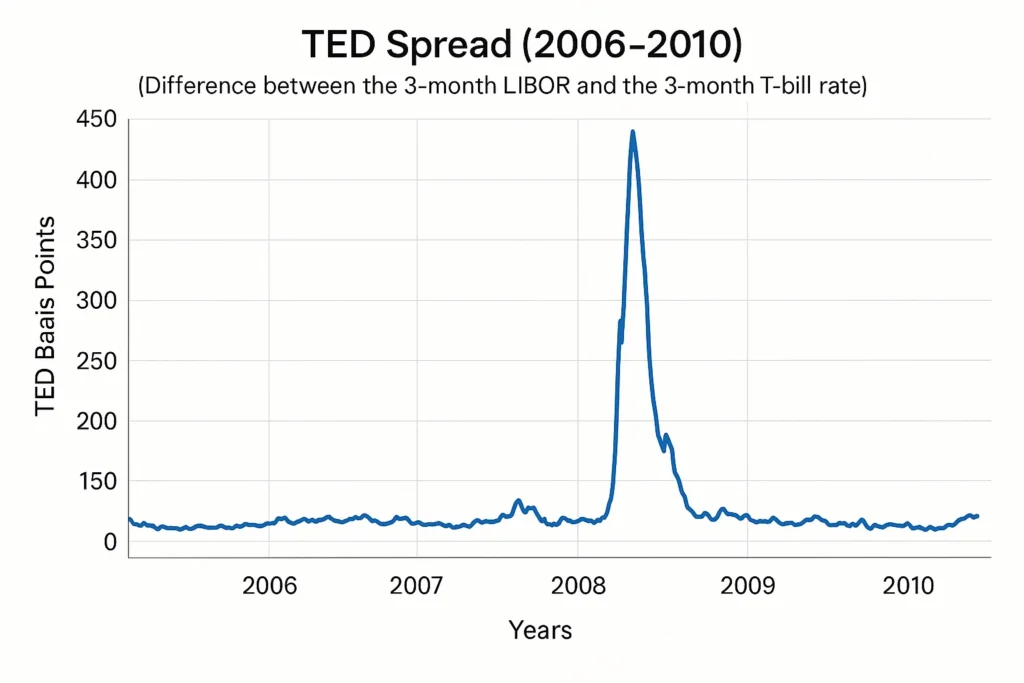
The Global Financial Crisis is a stark lesson in liquidity vanishing. Leading up to 2008, banks held massive amounts of mortgage-backed securities (MBS) that were considered liquid. However, when the underlying mortgages began to default, the market for these assets froze entirely. They became “toxic” and illiquid.
Banks like Lehman Brothers, despite having vast assets on paper, could not sell them to raise cash to meet their short-term obligations. This liquidity crisis triggered a solvency crisis, leading to collapse, government bailouts, and a global credit crunch. It perfectly illustrates the difference between having assets and having liquid assets.

Conclusion
Ultimately, understanding liquidity provides a critical lens for evaluating both individual investments and overall market risk. It is the foundational element of sound financial health for both companies and individuals. While the ratios and concepts are powerful tools for risk assessment, as we’ve seen with the limitations and the 2008 crisis, they are not infallible. Liquidity analysis should be used in conjunction with other fundamental and technical analysis. By consciously incorporating liquidity considerations into your asset allocation and trading decisions, you build a more resilient and efficient portfolio. Start by checking the liquidity ratios of the next company you research and noting the trading volume of any asset before you buy.
Ready to put these liquidity concepts into action? The right tools are essential. We’ve meticulously reviewed and ranked the best online brokers for active traders and long-term investors to help you analyze market depth and company financials with ease.
How Liquidity Relates to Other Concepts
A key distinction is between Liquidity and Solvency.
| Feature | Liquidity | Solvency |
|---|---|---|
| What it measures | Short-term ability to pay debts (<12 months) | Long-term ability to meet all financial obligations |
| Time Horizon | Short-Term | Long-Term |
| Primary Use | Assessing immediate financial health | Assessing overall financial viability and bankruptcy risk |
| Key Ratios | Current Ratio, Quick Ratio | Debt-to-Equity Ratio, Interest Coverage Ratio |
Related Terms
- Bid-Ask Spread: The difference between the buying and selling price; a direct measure of market liquidity.
- Asset Allocation: The process of dividing an investment portfolio among different asset categories, where liquidity is a key factor.
- Volatility: Often related to liquidity; illiquid assets tend to be more volatile.
- Cash Equivalents: The most liquid assets on a balance sheet after cash itself.
Frequently Asked Questions
Recommended Resources
- U.S. Securities and Exchange Commission (SEC) EDGAR Database – To look up company financial statements.
- Investopedia: Liquidity Definition – For a foundational reference.
How did this post make you feel?
Thanks for your reaction!


