
Bitcoin Could Reach $74K
Bitcoin’s price action has long been a subject of intense scrutiny among traders and investors, with historical trend lines often providing critical insights into future movements. The attached chart, titled “Trend Line 2017-2025,” suggests that Bitcoin is at a pivotal juncture. If the price respects the long-term trend line established since 2017, we could see BTC rally toward the $74,000 level. This article breaks down the key elements of the chart, analyzes the significance of the trend line, and explores what traders should watch for in the coming months.
Key Takeaways from the Chart
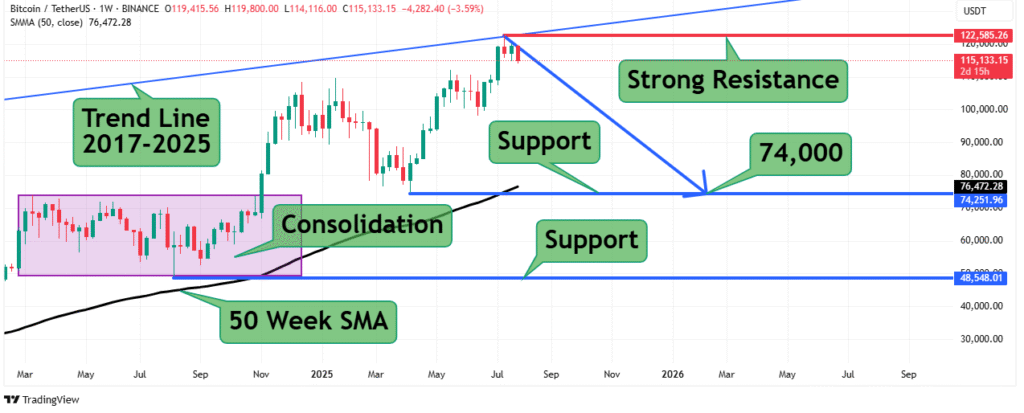
- Long-Term Trend Line (2017-2025)
The chart highlights a multi-year trend line that has acted as both support and resistance for Bitcoin over nearly a decade. This trend line is critical because:- It has historically marked major turning points in BTC’s price.
- A bounce from this level could signal the start of a new bullish phase.
- Consolidation and the 50-Week SMA
The “Consolidation” label suggests that Bitcoin is in a period of price compression, with the 50-week Simple Moving Average (SMA) serving as a dynamic support level. The interplay between the trend line and the 50-week SMA could determine whether BTC breaks out or breaks down. - Strong Resistance and Support Levels
The chart notes:- Strong Resistance: Likely referring to the $74,000 zone, which has been a psychological and technical barrier.
- Support Levels: Key areas at $60,000, $49,998, and $40,000, with $74,251.96 highlighted as a critical level to watch.
- Price Targets
The chart lists several price points, including:- Short-term resistance at $74,000.
- Ambitious upside targets like $129,000 and even $241,100 (likely long-term speculative projections).
- Downside levels such as $49,998 and $40,000 in case of a breakdown.
The $74,000 Scenario: What Needs to Happen?
For Bitcoin to rally toward $74,000, the following conditions must be met:

- Respect the 2017-2025 Trend Line
- The price must hold above this trend line, confirming it as support. A bounce here would validate the bullish structure.
- A breakdown below this line could invalidate the setup and lead to deeper corrections.
- Break Through Immediate Resistance
- Bitcoin needs to clear the $74,000 resistance, which has been a stubborn ceiling in recent months.
- Volume and momentum must accompany the breakout to confirm its validity.
- 50-Week SMA as a Springboard
- The 50-week SMA should act as a launchpad for upward movement. A sustained hold above this average would reinforce bullish sentiment.
Risks Associated
While the chart paints a bullish picture, traders should remain cautious of:
- False Breakouts: Bitcoin has a history of fakeouts near key levels. A failed breakout above $74K could lead to a sharp pullback.
- Macroeconomic Factors: Interest rates, regulatory news, and macroeconomic instability could disrupt BTC’s trajectory.
- Trend Line Breakdown: If BTC closes decisively below the 2017-2025 trend line, the next major support zones would be $60K and $49,998.
Conclusion: A Make-or-Break Moment for Bitcoin
The “Trend Line 2017-2025” chart underscores a critical inflection point for Bitcoin. If the price respects this long-term trend line and bounces, the path to $74,000 and potentially higher, remains open. However, failure to hold this level could trigger a deeper correction.
Key Levels to Watch:
- Upside: $74,000 (immediate resistance), $129,000 (long-term target).
- Downside: $60,000, $49,998, and $40,000 (support zones).
Traders should monitor price action around the trend line and the 50-week SMA closely. A confirmed breakout with strong volume could signal the next leg up, while a breakdown would require a reassessment of the bullish thesis.
Disclaimer: This is not financial advice. Always conduct your own research before making trading decisions.
