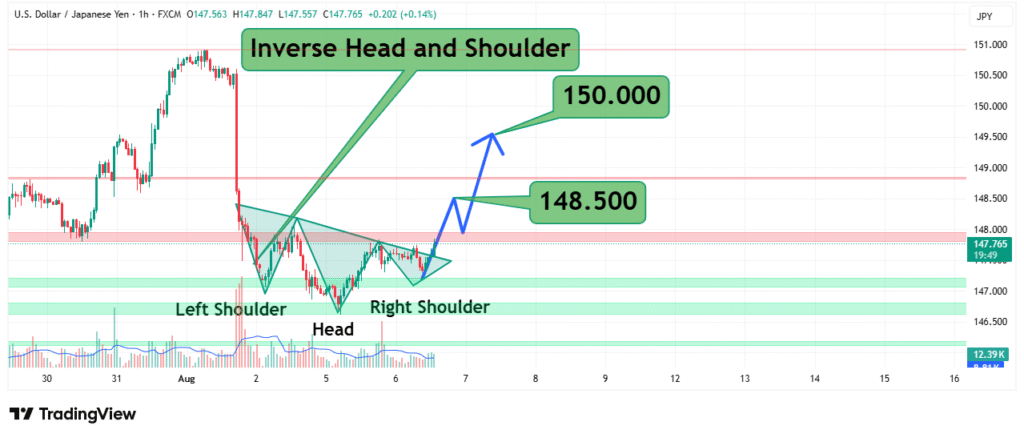
USDJPY at Turning Point 150.00 Breakout Could Spark Rally!
The USD/JPY currency pair has recently formed a compelling technical pattern—the Inverse Head and Shoulders (IH&S) a classic bullish reversal formation that often precedes a significant upward move. This article provides a deep dive into the structure of this pattern, key price levels to watch, and the fundamental forces driving the pair. Whether you’re a forex trader, a macroeconomic analyst, or simply interested in currency markets, this guide will help you understand the potential implications of this setup.
Understanding the Inverse Head and Shoulders Pattern
The Inverse Head and Shoulders (IH&S) is a bullish reversal pattern that appears after a downtrend, signaling a potential trend reversal. It consists of three main components:
- Left Shoulder – A decline followed by a bounce, forming the first trough.
- Head – A deeper decline (lower low) followed by another bounce.
- Right Shoulder – A third decline that doesn’t go as low as the head, followed by a breakout above the neckline (resistance level connecting the highs between the shoulders and head).
In the case of USD/JPY, the pattern is forming around 148.500–151.000, with the neckline acting as a critical breakout zone. A confirmed breakout above this level could trigger a strong bullish move.
Why This Pattern Matters
- Reliability: IH&S is one of the most trusted reversal patterns in technical analysis.
- Measured Move Target: The projected upside is often equal to the distance from the head’s low to the neckline, added to the breakout point.
- Volume Confirmation: Ideally, breakout moves should be accompanied by increasing trading volume for validation.
Key Price Levels to Watch
The USD/JPY pair is currently hovering around critical levels, with the following zones acting as support and resistance:

Support Levels (Bullish Defense)
- 148.500 – The “head” of the pattern, a major support.
- 147.750–147.000 – Strong historical demand zone.
- 146.500 – A psychological floor; breaking below could invalidate the bullish setup.
Resistance Levels (Breakout Targets)
- 150.000 – Immediate resistance and neckline breakout confirmation.
- 151.000 – Previous swing high; a break here could accelerate buying.
- 152.000–153.000 – Next major resistance if momentum continues.
- 180.500–190.000 – Long-term Fibonacci extension targets (if a major bullish trend resumes).
A decisive close above 150.000 would confirm the IH&S pattern, opening the door for a rally toward 151.000 and beyond.
Fundamental Drivers Behind USD/JPY
While technicals suggest a bullish reversal, fundamentals play an equally crucial role in USD/JPY’s direction. Here are the key factors at play:
1. Bank of Japan (BoJ) Policy & Yield Curve Control (YCC)
- The BoJ has maintained ultra-loose monetary policy, keeping interest rates near zero.
- Any hints of policy normalization (like adjusting YCC) could strengthen the JPY, pressuring USD/JPY downward.
- However, if the BoJ remains dovish, the yen may weaken further, supporting USD/JPY upside.
2. Federal Reserve’s Interest Rate Stance
- The Fed’s hawkish or dovish signals directly impact the USD.
- If the Fed delays rate cuts, the dollar could strengthen, pushing USD/JPY higher.
- Conversely, if rate cuts come sooner than expected, USD/JPY may face downward pressure.
3. Risk Sentiment & Carry Trade Dynamics
- USD/JPY is a popular carry trade pair due to Japan’s low rates.
- In risk-on environments, traders borrow JPY (low yield) to buy higher-yielding assets, weakening the yen.
- Geopolitical tensions or market crashes could trigger JPY safe-haven flows, reversing gains.
4. Economic Data Surprises
- U.S. inflation (CPI, PCE) and jobs data (NFP) can cause volatility.
- Japanese wage growth and inflation trends may influence BoJ policy shifts.
Trading Strategies for USD/JPY
Given the IH&S pattern and fundamental backdrop, here are strategic approaches:
1. Breakout Trade (Aggressive Bullish)
- Entry: Wait for a daily close above 150.000 (neckline).
- Target: 151.000 (initial), 152.000–153.000 (extended).
- Stop-loss: Below 148.500 (head level).
2. Pullback Trade (Conservative Entry)
- If USD/JPY retests 149.000–148.500 and holds, enter long.
- Target 150.000+, stop below 147.750.
3. Range-Bound Approach (If Breakout Fails)
- If price oscillates between 148.500–150.000, trade reversals at support/resistance.
4. Fundamental-Driven Swing Trade
- Monitor Fed/BoJ speeches; if BoJ stays dovish and Fed remains hawkish, hold long positions.
Potential Risks & Invalidating Scenarios
- False Breakout: If USD/JPY surges above 150.000 but quickly reverses, the pattern fails.
- BoJ Policy Shift: Unexpected tightening could trigger a sharp JPY rally.
- Risk-Off Sentiment: Stock market sell-offs may strengthen JPY as a safe haven.
Conclusion: Will USD/JPY Break Higher?
The Inverse Head and Shoulders pattern suggests a bullish reversal is possible, but confirmation requires a sustained break above 150.000. Traders should combine technical signals with fundamental analysis—watching Fed and BoJ policies closely.
If the breakout holds, 151.000–153.000 becomes the next battleground. However, failure to hold 148.500 could see a retest of 147.000 support.


