S&P 500 Faces Resistance Price Prediction at 6,373 and 6,300 USD
The S&P 500 has experienced a strong upward trend in recent weeks, but the latest price action indicates that the index may be facing a significant resistance level. For traders and investors, understanding these technical zones is crucial to anticipate potential market movements. In this analysis, we break down the current resistance, support levels, and possible price targets that could shape the short-term outlook of the index.
Current Market Overview
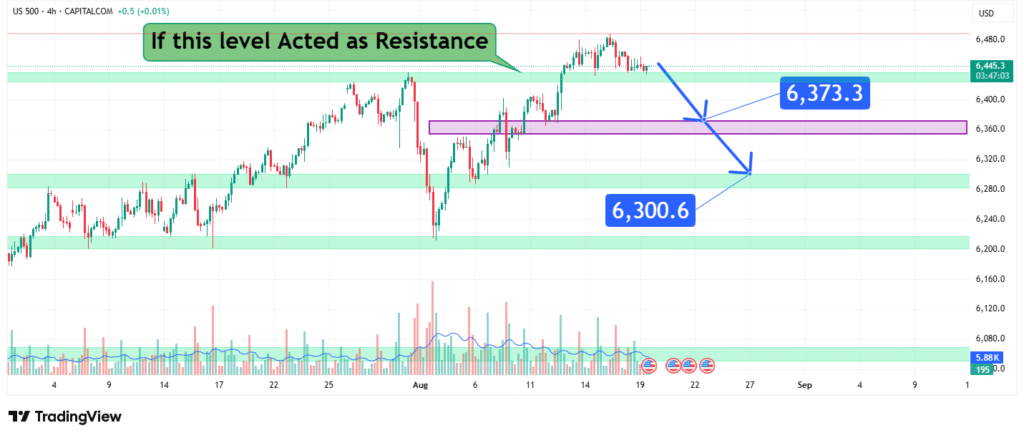
On the 4-hour chart, the S&P 500 has approached a major resistance zone around 6,445 USD. This level has historically acted as both a barrier and a pivot point for price action. If the market fails to break and sustain above this zone, it could trigger a corrective pullback.
Volume analysis also shows a decline in buying pressure compared to previous rallies, suggesting that momentum may be weakening. This increases the probability of a retracement toward lower support levels.
Key Resistance Level
The highlighted green resistance zone near 6,445 USD is the level to watch. If the index cannot push higher, sellers may gain control, creating downward pressure. Market psychology suggests that traders often lock in profits at resistance, leading to a potential short-term decline.
Predicted Downside Targets
Based on the technical chart setup:
- First Target: 6,373 USD
- This level aligns with a previously tested support zone. If selling pressure emerges, this will likely be the first checkpoint for a potential retracement.
- A drop to this level would still be considered a healthy correction within the broader uptrend.
- Second Target: 6,300 USD
- If bearish momentum intensifies, the index could extend its decline toward 6,300 USD, another key support level identified on the chart.
- Breaking below this level could shift sentiment more bearish, raising the risk of a deeper correction.
Market Outlook and Trading Considerations
While the overall long-term trend of the S&P 500 remains bullish, short-term resistance suggests caution. Traders should watch for confirmation signals such as candlestick rejection patterns, volume spikes, or failed breakouts near 6,445 USD before positioning for a downside move.
For risk management, stop-loss levels above 6,445 USD are recommended for short positions. Conversely, if the index successfully breaks and sustains above this resistance, bullish continuation could invalidate the downside targets.
Conclusion
The S&P 500 is at a critical juncture. If the resistance around 6,445 USD holds firm, the index is likely to retrace toward 6,373 USD and possibly 6,300 USD in the coming sessions. Traders should remain cautious, monitor price action closely, and prepare for both breakout and pullback scenarios.
How did this post make you feel?
Thanks for your reaction!
