USDCHF Price Analysis Bullish Rebound Targets 0.9070 Resistance
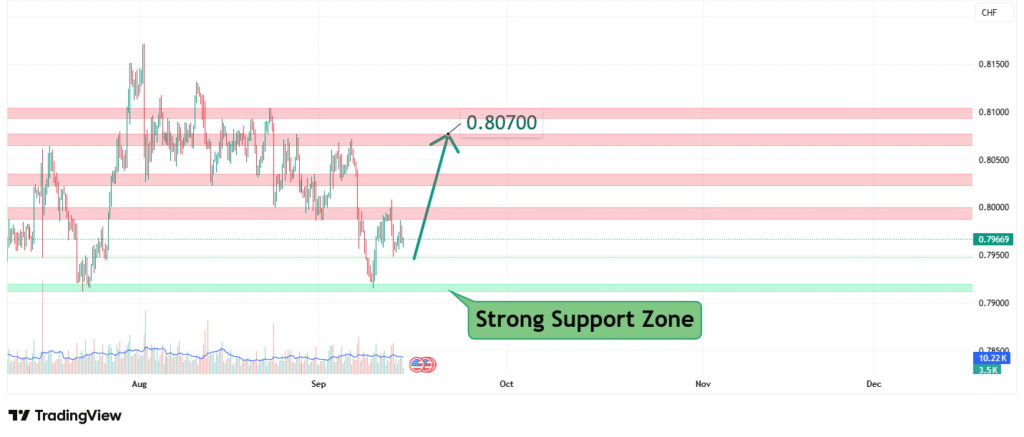
USDCHF’s price has experienced a significant decline but is now showing early signs of potential exhaustion near current levels. This price action suggests a bullish corrective rebound is probable. Our analysis projects a move towards an initial target of 0.90700. This prediction is based on a confluence of technical factors, including oversold conditions and the potential for a retest of broken support as new resistance.
Current Market Structure and Price Action
The broader market structure for USDCHF remains bearish. However, within a strong downtrend, markets rarely move in a straight line and often experience sharp counter-trend rallies. The price is currently trading near recent lows, and recent price action may be showing signs of consolidation or minor bullish divergence on intraday charts, indicating that a temporary bounce or relief rally may be imminent.
Identification of the Key Resistance Zone (Target)
The most critical technical element for this bullish setup is the Resistance Zone around 0.90700. The significance of this zone is derived from:
- Historical Significance: This level acted as a minor support zone prior to the most recent breakdown. According to classic technical analysis principles, former support often turns into new resistance once broken.
- Technical Confluence: The level aligns with a 23.6% or 38.2% Fibonacci retracement of the recent down move (exact level would depend on the swing high chosen), adding mathematical significance to the psychological level.
- Market Psychology: This area represents a point where sellers who missed the initial move down are likely to re-enter short positions, making it a logical initial target for a bullish correction.
This confluence makes it a high-probability level for a bearish reaction to begin anew, which is why it is our profit target for a bullish trade.
Technical Target(s) and Rationale
Our analysis identifies the following bullish price target:
- Primary Target (PT1): 0.90700
- Rationale: This is the primary and most logical target for a bullish correction. It represents a previous support level that is likely to now act as resistance. It also represents a typical Fibonacci retracement level for a pullback within a downtrend. A move to this level would represent a complete and successful corrective rally.

Prediction: We forecast that the price will stage a technical rebound from its current oversold state, initiating a move towards our primary target at 0.90700.
Risk Management Considerations
A professional strategy is defined by its risk management, especially when trading counter to the prevailing trend.
- Invalidation Level (Stop-Loss): The entire bullish correction thesis is invalidated if the price achieves a sustained daily close below 0.8950. This level is chosen to allow for some noise below the recent lows while protecting against a definitive breakdown and acceleration of the underlying bear trend.
- Position Sizing: Any long positions taken should be sized so that a loss triggered at the 0.8950 invalidation level represents a small, pre-defined percentage of your total capital (e.g., 1-2%). This is a counter-trend trade and should be sized more cautiously than a trend-following trade.
Fundamental Backdrop
The technical setup is framed by the current fundamental landscape:
- USD Strength: Any short-term bounce in the broader US Dollar Index (DXY) would be the most likely catalyst for a USDCHF rebound.
- SNB Intervention: The Swiss National Bank (SNB) has historically intervened to weaken the Franc (CHF). Verbal or actual intervention can cause sharp, short-covering rallies in USDCHF.
- Risk Sentiment: A sudden deterioration in global risk sentiment can sometimes benefit the USD as a safe-haven, potentially leading to a short-term rally in USDCHF against the trend.
These factors could provide the catalyst for the short-term bullish move outlined in this analysis.
Conclusion
USDCHF is showing potential for a technical rebound within a broader bearish trend. The weight of evidence suggests a bullish corrective move towards 0.90700. Traders should approach this as a shorter-term counter-trend opportunity and manage risk diligently by respecting the key invalidation level at 0.8950. The reaction at the 0.9070 target will be crucial for determining if the bearish trend resumes immediately or if a larger consolidation is underway.
Chart Source: TradingView
Disclaimer: This analysis is for informational and educational purposes only and does not constitute financial advice or a recommendation to buy or sell any security. All trading and investing involves significant risk, including the possible loss of your entire investment. Always conduct your own research (DYOR) and consider seeking advice from an independent financial professional before making any trading decisions.


