Volatility What It Is, How It's Measured, and Why It Matters for Your Portfolio
Volatility is the statistical measure of the dispersion of returns for a given security or market index. In simpler terms, it quantifies how wildly and rapidly an asset’s price moves up and down. For traders and investors in the US, UK, Canada, and Australia, understanding volatility is essential for managing risk, setting expectations, and identifying potential opportunities in markets like the S&P 500, FTSE 100, or ASX 200.
Summary Table
| Aspect | Detail |
|---|---|
| Definition | A measure of the degree of variation of an asset’s trading price over time. |
| Also Known As | Statistical Volatility (SV), price swing, market choppiness. |
| Main Used In | Options Trading, Risk Management, Portfolio Construction, Crypto Markets. |
| Key Takeaway | High volatility equals higher risk and potential reward; low volatility suggests price stability. |
| Formula | Standard Deviation of logarithmic returns (Annualized). |
| Related Concepts |
What is Volatility
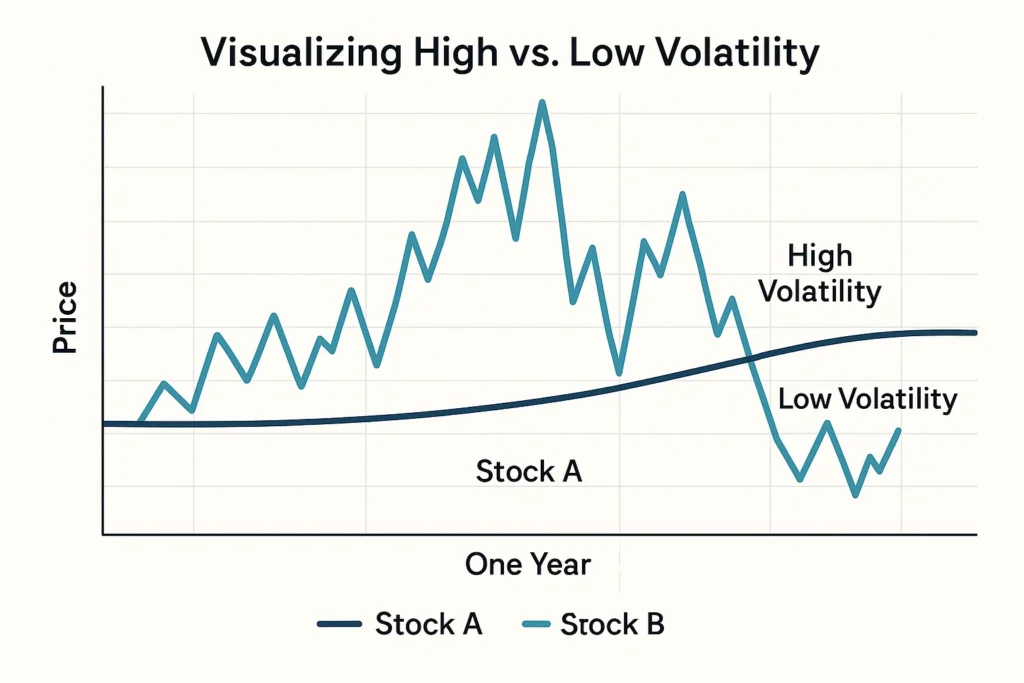
At its core, volatility is a measure of uncertainty or risk based on the magnitude of an asset’s price changes. If you imagine an asset’s price journey as a path, low volatility would be a smooth, straight road. High volatility would be a winding, bumpy mountain passes with sharp turns and steep drops.
It’s crucial to distinguish between direction and volatility. An asset can be in a strong uptrend or downtrend (directional move) but still have low volatility if the price moves steadily without large daily swings. Conversely, an asset can have high volatility while trading sideways, with sharp up and down moves that cancel each other out.
Key Takeaways
The Core Concept Explained
Volatility measures the “noisiness” of price movements. A higher volatility value indicates that an asset’s price can potentially be spread out over a larger range of values. This means the price can change dramatically in a short period in either direction. A lower volatility means that an asset’s price is more stable and doesn’t fluctuate as dramatically.
What does it measure? It measures the dispersion of an asset’s returns around its average return over a specific period.
How to Calculate Volatility
The most common measure of volatility is the standard deviation of logarithmic returns. The formula for the standard deviation (σ) of a dataset is:
σ = √[ Σ (xi – μ)² / N ]
Where:
- σ = Standard Deviation (Volatility)
- xi = Each individual value in the dataset (each daily return)
- μ = The mean (average) of all values in the dataset (the average return)
- N = The number of values in the dataset
- Σ = The sum of
Step-by-Step Calculation Guide
To calculate the historical volatility of a stock (e.g., Apple Inc. listed on the NASDAQ) over 5 days:
- Gather Prices: Collect the closing prices for 5 consecutive trading days.
- Calculate Daily Returns: Compute the percentage change from one day to the next. (More precisely, use logarithmic returns for mathematical consistency).
- Find the Average Return: Calculate the average of these daily returns. This is μ.
- Find the Variance: For each day’s return, subtract the average return (xi – μ), square the result, and then average these squared differences.
- Take the Square Root: The standard deviation (volatility) is the square root of the variance.
This gives you the daily volatility. To annualize it (the standard on Wall Street), multiply by the square root of the number of trading days in a year (typically √252).
Example Calculation Table:
| Day | AAPL Closing Price | Daily Return (%) | (Return – Avg Return)² |
|---|---|---|---|
| 1 | $150.00 | — | — |
| 2 | $152.00 | +1.33% | (0.0133 – 0.008)² = 0.000028 |
| 3 | $151.50 | -0.33% | (-0.0033 – 0.008)² = 0.000127 |
| 4 | $153.50 | +1.32% | (0.0132 – 0.008)² = 0.000027 |
| 5 | $155.00 | +0.98% | (0.0098 – 0.008)² = 0.000003 |
| Average Return (μ) | — | 0.80% (0.008) | — |
| Variance | — | — | Σ / 4 = 0.00004625 |
| Daily Std Dev (σ) | — | — | √0.00004625 = 0.680% |
| Annualized Volatility | — | — | 0.680% * √252 ≈ 10.8% |
Interpretation: An annualized volatility of 10.8% suggests that, based on recent history, AAPL’s price is expected to stay within a range of ±10.8% from its average price over the course of a year (with a 68% statistical probability).
Why Volatility Matters to Traders and Investors
- For Traders: Volatility is the lifeblood of many trading strategies. High volatility creates larger price swings, which can lead to greater profit potential on short-term trades. Options traders, in particular, rely on volatility, as it directly impacts the price of options contracts (a concept known as “Vega”).
- For Investors: Long-term investors use volatility to assess risk. A more volatile stock is considered riskier. Understanding volatility helps in constructing a diversified portfolio that matches your risk tolerance. An investor nearing retirement might avoid highly volatile assets.
- For Analysts: Volatility is a key input in financial models, including the famous Black-Scholes model for options pricing. It’s also used to calculate risk-adjusted returns like the Sharpe Ratio, helping analysts compare the performance of different assets.
How to Use Volatility in Your Strategy
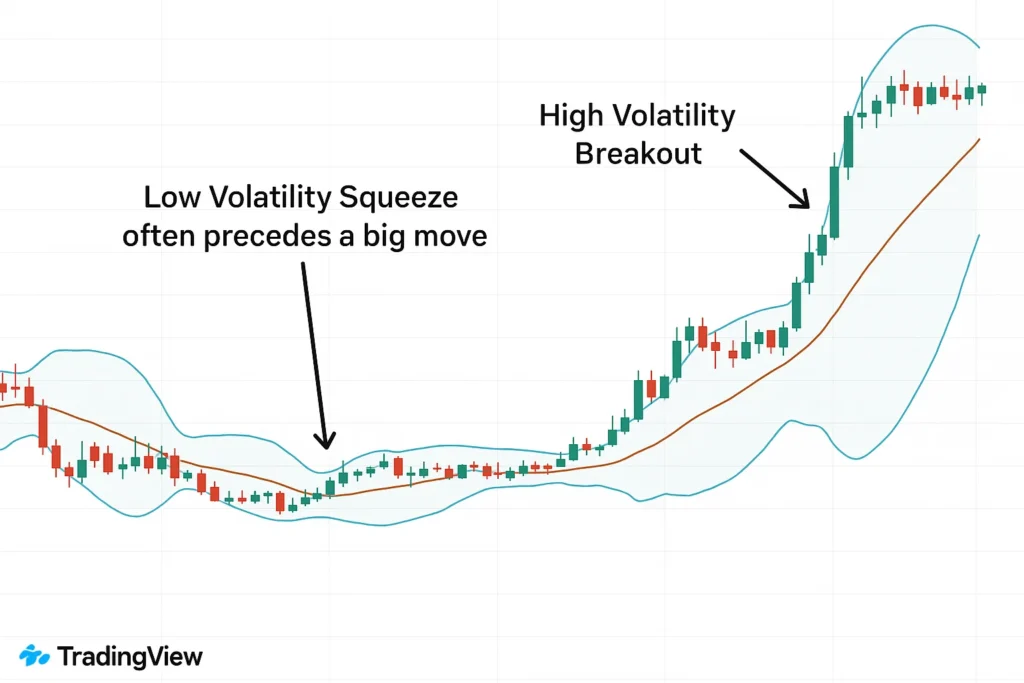
- Case 1: Identifying Trading Ranges (Bollinger Bands): Bollinger Bands are a popular technical indicator that uses standard deviation. A contraction of the bands, commonly known as a “squeeze,” signals a period of exceptionally low volatility and frequently acts as a precursor to a substantial price movement. Traders watch for the squeeze to end and a new trend to begin.
- Case 2: Gauging Market Fear (The VIX): The CBOE Volatility Index (VIX) measures the market’s expectation of 30-day volatility for the S&P 500. A high VIX (e.g., above 30) indicates fear and uncertainty, often during market sell-offs. A low VIX (e.g., below 20) suggests complacency and stability. Traders might use a high VIX as a contrarian “fear” indicator.
To start tracking volatility indicators like Bollinger Bands on your own charts, you’ll need a reliable brokerage platform with strong charting tools.
- Quantifiable Risk: It provides a concrete number to represent risk, making it easier to compare different assets.
- Strategy Foundation: It is the cornerstone of many effective trading and hedging strategies, especially in options.
- Expectation Setting: Helps investors understand the potential price swings they might experience.
- Directionally Blind: Volatility measures the magnitude of movement, not the direction. A stock can be volatile and go straight up, which most investors wouldn’t complain about.
- Backward-Looking: Standard deviation measures historical volatility, which may not predict future volatility.
- Assumes Normal Distribution: The calculation assumes price returns are normally distributed, but in reality, financial markets experience “fat tails” (extreme events happen more often than the model predicts).
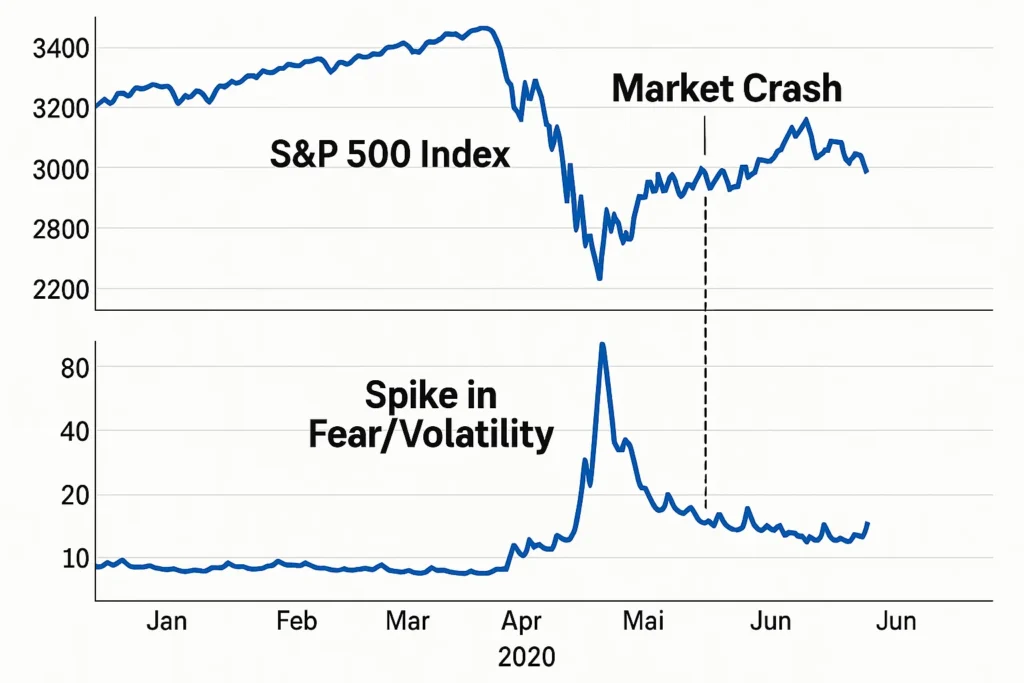
Volatility in the Real World: The 2020 COVID-19 Crash
The market reaction to the COVID-19 pandemic in March 2020 is a perfect case study of extreme volatility. As lockdowns were announced globally, uncertainty skyrocketed.
- The VIX Spike: The VIX index, which had been trading around 15, exploded to an all-time high above 82 in March 2020. This indicated massive fear and expectation of huge price swings.
- Daily Swings: The S&P 500 experienced daily moves of ±5% or more frequently. For example, it fell nearly 12% on March 16th, one of its worst days in history, only to be followed by sharp up days.
- Opportunity and Risk: This period was extremely risky for investors, but the high volatility also created significant opportunities for traders who could navigate the swings.
Conclusion
Ultimately, understanding volatility provides a critical lens for evaluating risk and potential reward in any market. While it is a powerful tool for quantifying price swings and forming strategies, as we’ve seen, it’s not infallible and should be used in conjunction with other forms of analysis like fundamental research. By incorporating an awareness of volatility into your overall strategy—whether you’re a day trader using Bollinger Bands or a long-term investor checking the VIX. This knowledge empowers you to base your financial choices on concrete data, ensuring they are tailored to your specific investment objectives and comfort with risk.
Ready to analyze volatility for your portfolio? The right tools are essential. We’ve meticulously reviewed and ranked the best online brokers for active trading and long-term investing to help you get started.
How Volatility Relates to Other Concepts
The most common point of confusion is between Volatility and Beta.
| Feature | Volatility | Beta |
|---|---|---|
| What it measures | Total price fluctuation (ups and downs) relative to its own average. | Price fluctuation relative to the overall market (e.g., S&P 500). |
| Benchmark | Itself (no benchmark). | A market index (benchmark-dependent). |
| Indicates | Total, standalone risk. | Systematic, non-diversifiable risk. |
| Primary Use | Assessing absolute risk and options pricing. | Assessing a stock’s risk contribution to a diversified portfolio. |
Related Terms
- VIX (Volatility Index): The market’s forecast of future volatility, derived from S&P 500 index options.
- Beta: A degree of a stock’s volatility in relation to the overall market.
- Standard Deviation: The core statistical calculation behind volatility.
- Value at Risk (VaR): A risk management tool that uses volatility to estimate potential portfolio loss.
- Sharpe Ratio: A measure of risk-adjusted return that uses volatility in its denominator.
Frequently Asked Questions
Recommended Resources
- Trading Strategies for High Volatility Markets
- YouTube video explaining the VIX
- CBOE Global Markets: Official VIX Index Page
- U.S. Securities and Exchange Commission (SEC)
How did this post make you feel?
Thanks for your reaction!
