Bid-Ask Spread What It Is and How It Impacts Your Trades
The bid-ask spread is the hidden cost of every trade you make, representing the difference between the highest price a buyer will pay and the lowest price a seller will accept. It’s a direct measure of a security’s liquidity and trading cost. For active traders and long-term investors across the US, UK, Canada, and Australia, understanding the spread is fundamental to preserving capital and maximizing returns.
Whether you’re trading blue-chip stocks on the NYSE, forex pairs like EUR/USD, or cryptocurrencies on a major exchange, the bid-ask spread is the first friction point you encounter. Mastering it can significantly impact your bottom line.
Summary Table
| Aspect | Detail |
|---|---|
| Definition | The difference between the bid price (what buyers will pay) and the ask price (what sellers will sell for). |
| Also Known As | Spread, Buy-Sell Spread |
| Main Used In | Stock Trading, Forex, Options, Crypto, Bonds |
| Key Takeaway | The spread is a direct transaction cost; a narrower spread generally means better liquidity and lower costs. |
| Formula | Ask Price – Bid Price |
| Related Concepts |
What is the Bid-Ask Spread
Imagine you’re at a flea market. You see a vintage watch you like. The seller has a tag that says Asking Price: $100. You, as the buyer, think it’s worth $90 and offer that. The $10 difference between your bid and their ask is the spread. In financial markets, this happens millions of times per second.
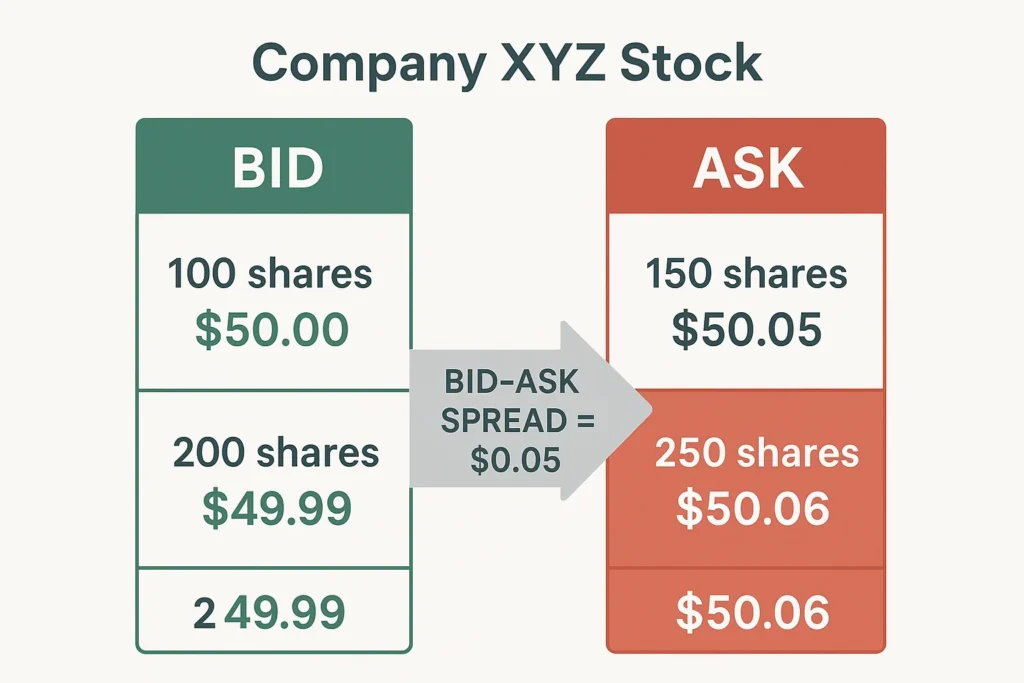
The Bid Price is the highest price a buyer in the market is currently willing to pay for an asset. The Ask Price (or Offer Price) is the lowest price a seller is currently willing to accept. The Bid-Ask Spread is simply the gap between these two prices. This spread is the primary source of profit for market makers and represents an immediate loss for a trader who buys and instantly sells an asset.
Key Takeaways
The Core Concept Explained
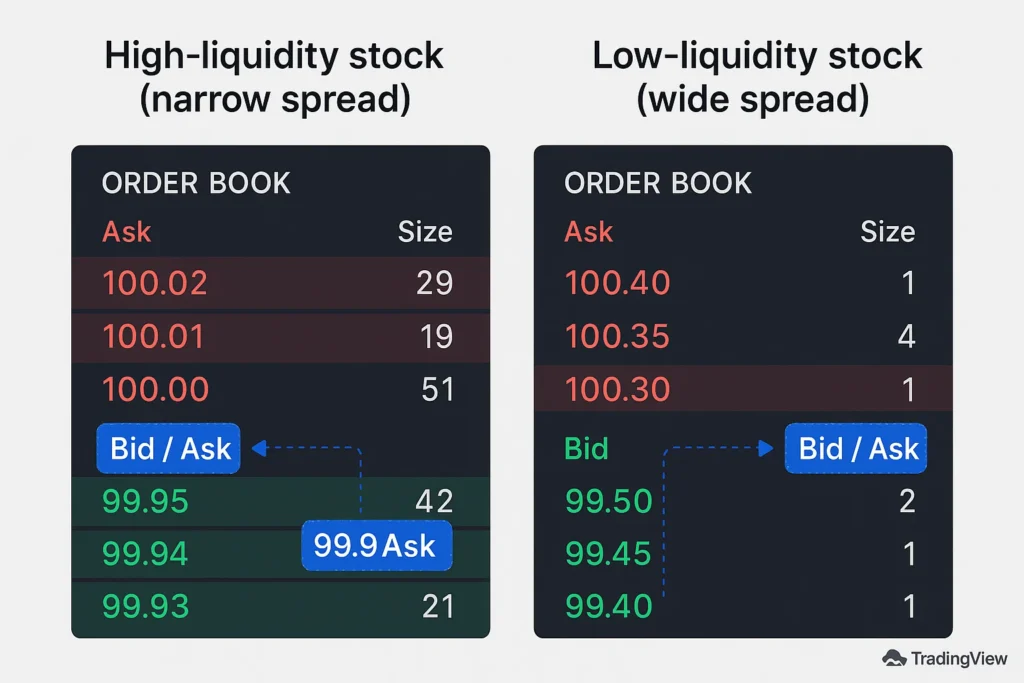
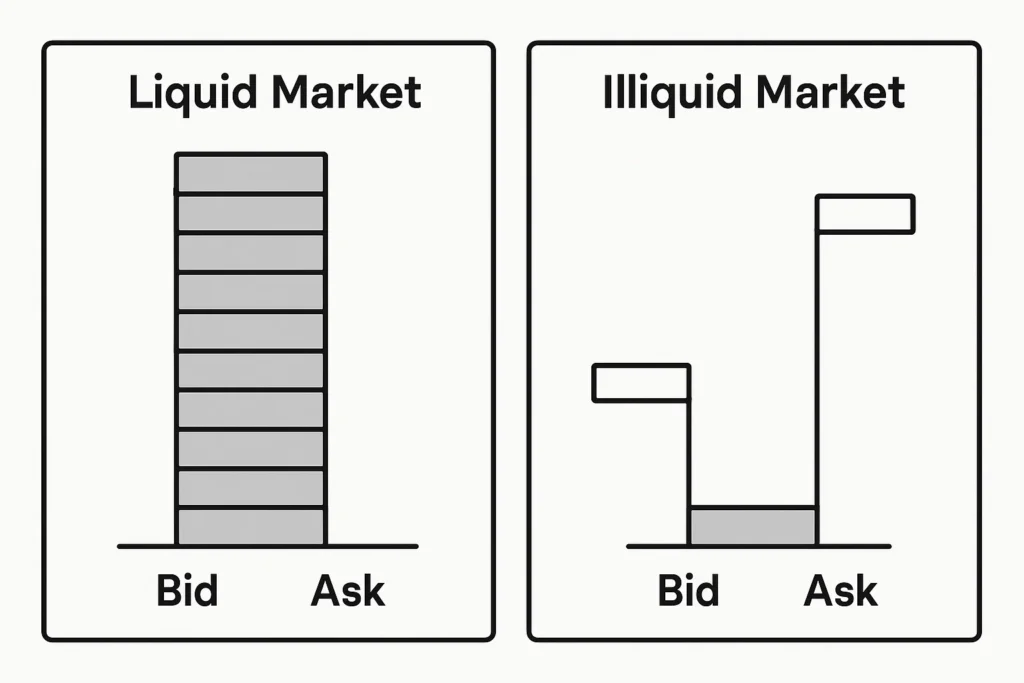
The spread measures the supply and demand for an asset in real-time. A narrow spread indicates a high level of consensus on price and a deep pool of buyers and sellers, which is characteristic of liquid markets. A wide spread suggests the opposite: lower liquidity, higher volatility, and greater disagreement on the asset’s value.
How to Calculate the Bid-Ask Spread
The calculation is straightforward. You can express it as an absolute value or a percentage.
Formula:
Bid-Ask Spread (Absolute) = Ask Price – Bid Price
Bid-Ask Spread (%) = ( (Ask Price – Bid Price) / Ask Price ) * 100
Step-by-Step Calculation Guide
Let’s break it down with a real-world example using a stock listed on the NASDAQ.
Example Calculation:
- Input Values: A share of TechCorp Inc. has a current Bid Price of $150.00 and an Ask Price of $150.10.
- Absolute Spread Calculation: $150.10 (Ask) – $150.00 (Bid) = $0.10
- Percentage Spread Calculation: ($0.10 / $150.10) * 100 = 0.0666%
Interpretation: A spread of 10 cents or 0.067% is very tight, indicating that TechCorp is a highly liquid stock. For a trader buying 100 shares, this spread represents an immediate cost of $10 the moment the trade is executed ($0.10 per share * 100 shares).
For a trader in the UK looking at a company on the London Stock Exchange (LSE), the calculation is the same but in GBP. For instance, a bid of £10.00 and an ask of £10.04 gives a spread of £0.04 or 0.4%. Understanding this cost is crucial when dealing with international brokers and their fee structures.
Why the Bid-Ask Spread Matters to Traders and Investors
- For Traders: The spread is a critical component of the break-even point. A day trader scalping the EUR/USD forex pair needs the price to move past the spread before they are in profit. A wide spread can turn a potentially profitable short-term signal into a losing trade due to higher initial costs.
- For Investors: While long-term investors may be less impacted by a single trade’s spread, costs compound over time. Consistently trading instruments with wide spreads, like some small-cap stocks or corporate bonds, can erode portfolio returns. It’s a key factor in transaction cost analysis.
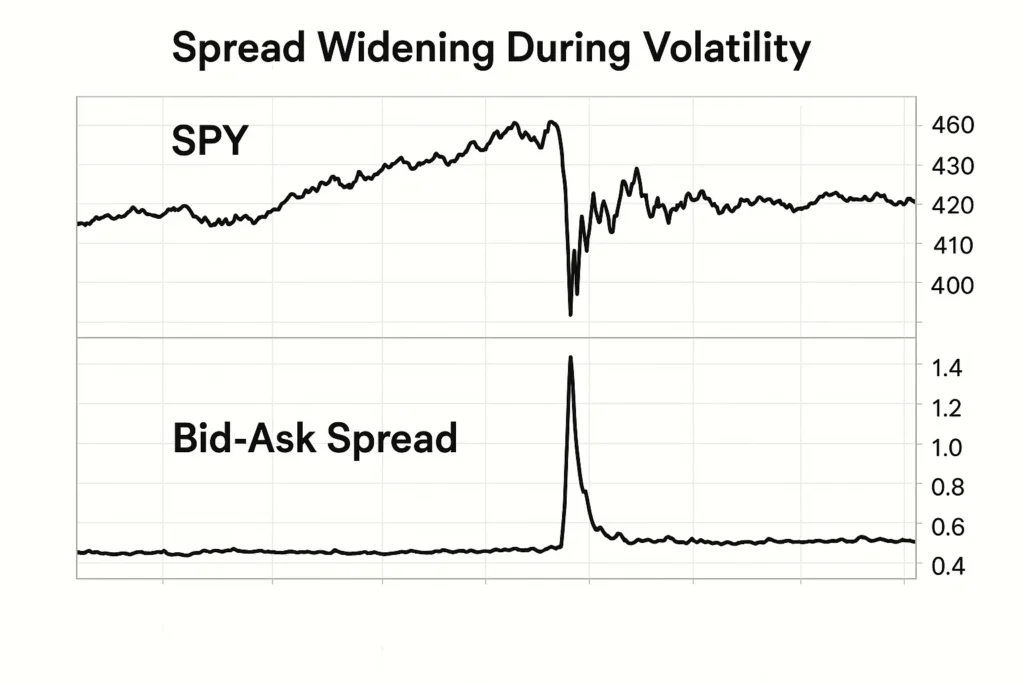
- For Analysts: The spread acts as a real-time liquidity gauge. A suddenly widening spread in a typically liquid stock can signal rising uncertainty, a pending news announcement, or a general flight to quality in the markets.
Bid-Ask Spreads Across Different Asset Classes
The bid-ask spread is a universal concept, but its behavior and impact vary dramatically depending on the market you’re trading. Understanding these differences is key to managing your expectations and costs.
| Asset Class | Typical Spread Characteristic | Why It’s Like This & Trader Implication |
|---|---|---|
| Blue-Chip Stocks (e.g., AAPL, MSFT) | Extremely Tight (e.g., $0.01 on a $150 stock) | Why: Massive trading volume and intense competition among dozens of market makers. Implication: The cost of trading is minimal, making these ideal for high-frequency and retail traders. |
| Forex (Major Pairs) (e.g., EUR/USD) | Very Tight (e.g., 0.5 – 1.0 pips) | Why: The forex market is the most liquid in the world. Spreads are the primary way many brokers make money. Implication: Costs are low, but watch for variable spreads that can widen during news events. |
| Small-Cap & Penny Stocks | Often Very Wide (e.g., $0.10 on a $2.00 stock = 5%) | Why: Low liquidity, low trading volume, and few market makers who demand higher compensation for the risk. Implication: A single trade can have a significant cost; limit orders are essential. |
| Cryptocurrencies | Wide Range (Tight on BTC, very wide on altcoins) | Why: Markets are fragmented across exchanges and lack the formalized market-making structure of stocks. 24/7 volatility increases risk for liquidity providers. Implication: Always check the spread on your specific exchange before placing a trade, especially for smaller coins. |
| Exchange-Traded Funds (ETFs) | Varies by Liquidity (SPY is tight, niche ETFs are wide) | Why: ETFs trade like stocks. Their spread is determined by the liquidity of the ETF itself and the underlying assets it holds. Implication: A wide spread on an ETF can be a hidden drag on returns, even for long-term investors. |
Navigating these different markets requires a broker that offers transparent pricing for your asset class of choice. Whether you’re focused on tight forex spreads or commission-free stock trading, doing your research is key.
How to Use the Bid-Ask Spread in Your Strategy
Use Case 1: Asset Selection for Day Trading
- Scenario: A day trader choosing between two similar stocks.
- Action: They will always prefer the stock with the tighter spread, all else being equal. For example, trading Apple (AAPL) with a 1-cent spread is far more cost-effective than trading a low-volume penny stock with a 10-cent spread.
Use Case 2: Setting Limit Orders
- Scenario: An investor wants to buy a stock but doesn’t want to pay the full ask price.
- Action: Instead of using a market order (which fills at the ask), they place a limit order at or near the current bid price. This allows them to potentially buy within the spread, effectively getting a better price. However, it also risks the order not being filled if the price moves away.
Use Case 3: Gauging Market Volatility
- Scenario: A forex trader is monitoring the GBP/USD pair during the London open.
- Action: They note the typical spread is 0.8 pips. If they see the spread suddenly jump to 3 pips, they know liquidity has dropped and volatility is high, prompting them to reduce position size or wait for conditions to normalize.
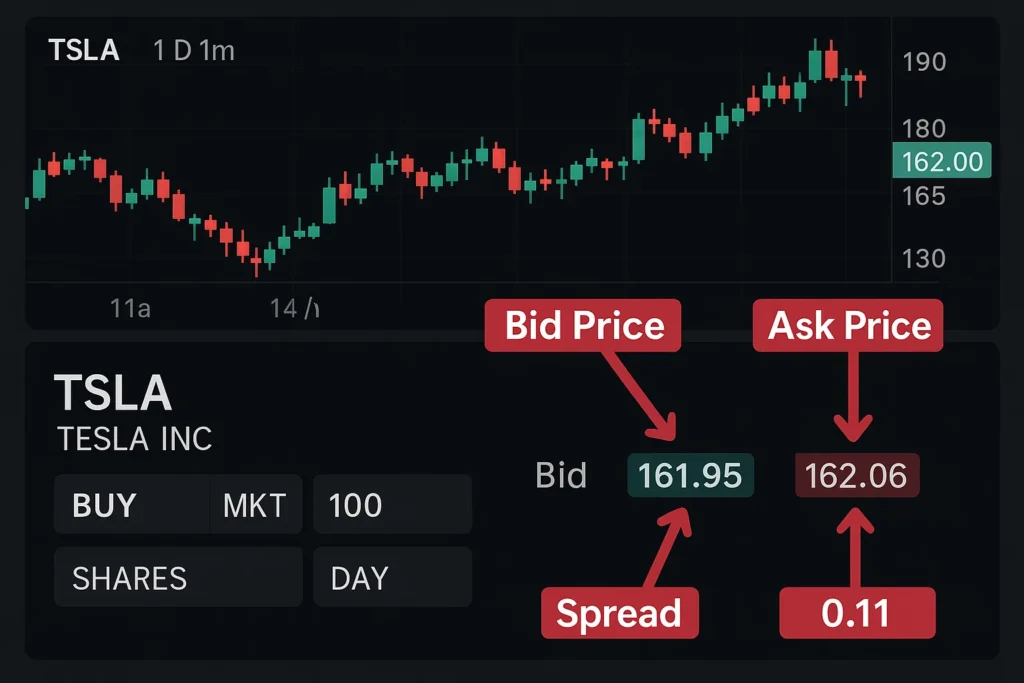
To effectively monitor spreads in real-time, you need a brokerage platform with a transparent and detailed order book. Choosing a broker with low, transparent pricing is crucial.
- Clear Cost Indicator: It provides a transparent, immediate view of the transaction cost for any trade.
- Real-Time Liquidity Gauge: One of the most accurate real-time indicators of an asset’s market depth and liquidity.
- Universal Applicability: The concept works across all asset classes — from stocks and ETFs to forex and crypto.
- Not the Whole Picture: The spread alone doesn’t account for slippage, which can occur during high volatility and lead to worse execution prices.
- Can Be Misleading in Thin Markets: A stock may show a tight spread but lack sufficient market depth, meaning a medium-sized order could still impact price.
- Variable and Unpredictable: Spreads can widen suddenly during news releases or economic data events, increasing trading costs unexpectedly.
The Anatomy of a Trade: How the Spread is Captured
It’s one thing to know what the spread is, but another to understand how it’s captured in a live market. Let’s demystify the process and identify who profits from this hidden cost.
When you place a market order, you aren’t buying from a random individual seller. In today’s electronic markets, you are most likely transacting with a market maker or a liquidity provider. These are large financial institutions or sophisticated algorithmic firms whose business is to facilitate trading by continuously quoting both a bid and an ask price. Their profit comes from the difference between the two, the bid-ask spread.
Let’s walk through a concrete example:
Imagine the market maker for Global Tech Corp (GTC) provides the following quotes:
- Bid Price: $200.00 (They are willing to buy 100 shares at this price)
- Ask Price: $200.10 (They are willing to sell 100 shares at this price)
- Spread: $0.10
Now, two separate events occur almost simultaneously:
- You place a market order to BUY 100 shares of GTC.
- Another Trader places a market order to SELL 100 shares of GTC.
Here’s what happens:
- Your buy order is executed at the best available ask price: $200.10. You now own 100 shares.
- The other trader’s sell order is executed at the best available bid price: $200.00. They have sold their 100 shares.
The Market Maker’s Result:
The market maker has sold 100 shares to you at $200.10 and bought 100 shares from the other trader at $200.00. They started with a neutral position (no shares) and ended with a neutral position (no shares), but they have pocketed a $10 profit ($0.10 per share x 100 shares) with zero market risk. This is the spread in action. They provided liquidity to both sides of the trade and were compensated for that service.
Key Insight for Traders: Every time you use a market order, you are effectively paying the spread to a market maker for the privilege of immediate execution. This is why understanding limit orders is so critical for cost control.
Bid-Ask Spread in the Real World: A Case Study
The Flash Crash of May 2010
During the infamous Flash Crash, the Dow Jones Industrial Average plummeted nearly 1,000 points in minutes. One of the most telling phenomena was the catastrophic widening of bid-ask spreads.
- What Happened: As liquidity evaporated and automated market makers withdrew, the balance between buyers and sellers collapsed. For many major, typically liquid stocks, the spread exploded.
- Example: Accenture (ACN), a highly liquid stock, saw its bid-ask spread blow out from a normal few cents to an astronomical gap. At one point, the bid was a penny, and the ask was over $100,000, a spread of 99,999.99%. This meant there was effectively no functional market.
- The Lesson: This extreme event highlights that liquidity is not guaranteed. Traders using market orders during this period suffered catastrophic losses, buying at prices thousands of times higher than intended or selling for just pennies. It underscores the importance of using limit orders and understanding that spreads are a dynamic, sometimes fragile, component of market structure.
Advanced Concepts: Latency and Liquidity Tiers
For those looking beyond the basics, two advanced concepts profoundly influence the bid-ask spread you see: Latency and Liquidity Tiers.
The Latency Arms Race
In the world of high-frequency trading (HFT), the spread isn’t just a static number, it’s a dynamic battlefield measured in microseconds. HFT firms invest millions in co-located servers (placing their computers physically next to an exchange’s) and ultra-fast data lines. Why?
The goal is to be the first to see a change in the market and react to it. If a large sell order is executed, momentarily pushing the price down, the fastest HFT firm can snap up the shares at the old, higher bid price before anyone else can cancel it. They can then turn around and sell them at the new, slightly lower price for a tiny, near-riskless profit. This competition ensures that spreads for major assets are incredibly efficient, but it also means the public quote you see can change before your order even reaches the exchange if you have a slow internet connection or a less direct broker routing.
Practical Takeaway: For retail traders, this underscores the danger of market orders during volatile periods. The spread you see may not be the spread you get, a phenomenon known as slippage.
Understanding Liquidity Tiers
Not all liquidity is created equal. In major markets, orders exist in different tiers or layers:
- Tier 1 (The Visible Spread): This is the top of the order book, the best bid and best ask that everyone sees. It’s what we typically refer to as the spread.
- Tier 2 (Market Depth): This is the list of buy and sell orders sitting below the best bid and above the best ask. It shows how much volume is available at incrementally worse prices.
- Tier 3 (Dark Pools & Off-Exchange Liquidity): These are large blocks of orders that are not visible on the public order book. They are designed for institutional players to move large positions without immediately impacting the market price.
Why does this matter? A stock can have a deceptively tight Tier 1 spread. However, if you look at the Tier 2 market depth and see only 100 shares at the best bid and then a huge gap down to the next bid, it means a moderately sized market sell order (e.g., for 5,000 shares) would cause significant slippage, eating through the thin liquidity and executing at much worse prices. The tight initial spread was a mirage.
Practical Takeaway: Before placing a large trade, always check the market depth (Level 2 data) on your trading platform. A deep order book with stacked volume at various price levels is a sign of genuine, resilient liquidity.
Conclusion
Ultimately, understanding the bid-ask spread provides a critical lens for evaluating trading costs and market efficiency. While it is a powerful and universal concept for assessing liquidity, as we’ve seen in extreme events, it is not infallible and can change rapidly. By consciously incorporating spread analysis into your overall strategy, opting for limit orders, favoring liquid assets, and avoiding trading during volatile news events, you can make more informed, cost-effective decisions that protect your capital and enhance your potential for returns. Start by simply observing the spreads on the assets in your watchlist on your brokerage platform.
Ready to find a broker that offers competitive spreads and robust trading tools? Choosing the right platform is the first step to managing your transaction costs effectively.
How Bid-Ask Spread Relates to Other Concepts
| Feature | Bid-Ask Spread | Slippage |
|---|---|---|
| What it is | The difference between the best bid and best ask price at a single moment in the market. | The difference between the expected execution price of a trade and the actual price it’s filled at. |
| When it occurs | Continuously, as a natural feature of all trading markets. | Typically occurs when a market order is placed or when a large trade impacts price movement. |
| Primary Cause | Driven by liquidity levels and the profit model of market makers. | Caused by sudden volatility or low market depth at the time of execution. |
| Control | Can be minimized by trading highly liquid assets with tight spreads. | Can be mitigated by using limit orders and avoiding large trades in illiquid or volatile markets. |
Related Terms
- Liquidity: The ease with which an asset can be bought or sold without affecting its price. The bid-ask spread is a direct measure of it.
- Market Depth: The volume of buy and sell orders sitting at different price levels beyond the best bid and ask. A deep market usually has a tight spread.
- Transaction Costs: The total costs of executing a trade, which includes the spread, broker commissions, and fees.
- Volume: The number of stocks or bonds traded in a security. High volume often, but not always, correlates with a narrow spread.
Frequently Asked Questions
Recommended Resources
- SEC.gov Market Structure Topics
- Investopedia.com – Bid-Ask Spread
